Dual Pixel Raw Focus Offset – Focus Consistency
(See Chart Features for general chart features - changing scales, copying to clipboard etc)
When the test mode is set to Raw and the Dual Pixel Raw option is enabled in both FoCal and on the camera, further information can be obtained about the real focus position.
Key:
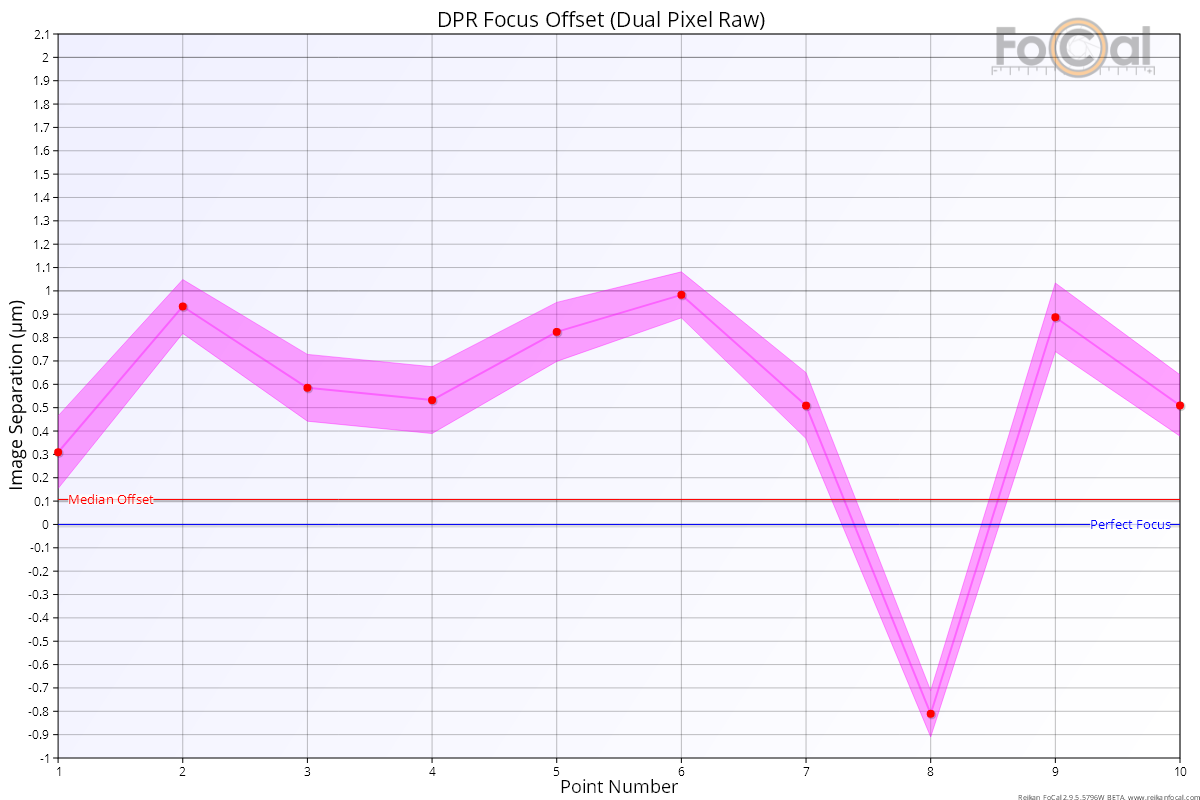
- Red circles – calculated measured perfect focus offset from the current focus position
- Pink area – indication of confidence of the measurement (the real result is somewhere within this area)
- Blue line – 0 offset (perfect focus) indicator line
- Red line – median offset across the whole test
Basic Interpretation
The DPR Focus Offset (Dual Pixel Raw Focus Offset) chart indicates the amount of separation between the A and B subpixel images of the dual-pixel sensor – this is directly proportional to the difference between the actual focus point and the “perfect” focus point. An image separation value of 0 microns means that the image is perfectly in focus.
The image separation metric specifically indicates what is happening at the sensor. How this relates to real-world focus offset depends on focal length, aperture and subject distance, so it's important to understand that this is NOT a direct indication of focus offset at the target. However, for a given focal length, aperture and focus distance, the values can be directly compared.
The example above shows a well calibrated lens behaving as expected. A good indication of correct calibration is that the variation of focus position moves both sides of the blue “perfect focus” line, and the median value is very low (very close to the blue line).
This is a new metric and we are currently collecting data to be able to process into more immediately meaningful information in a future update.
Further Details
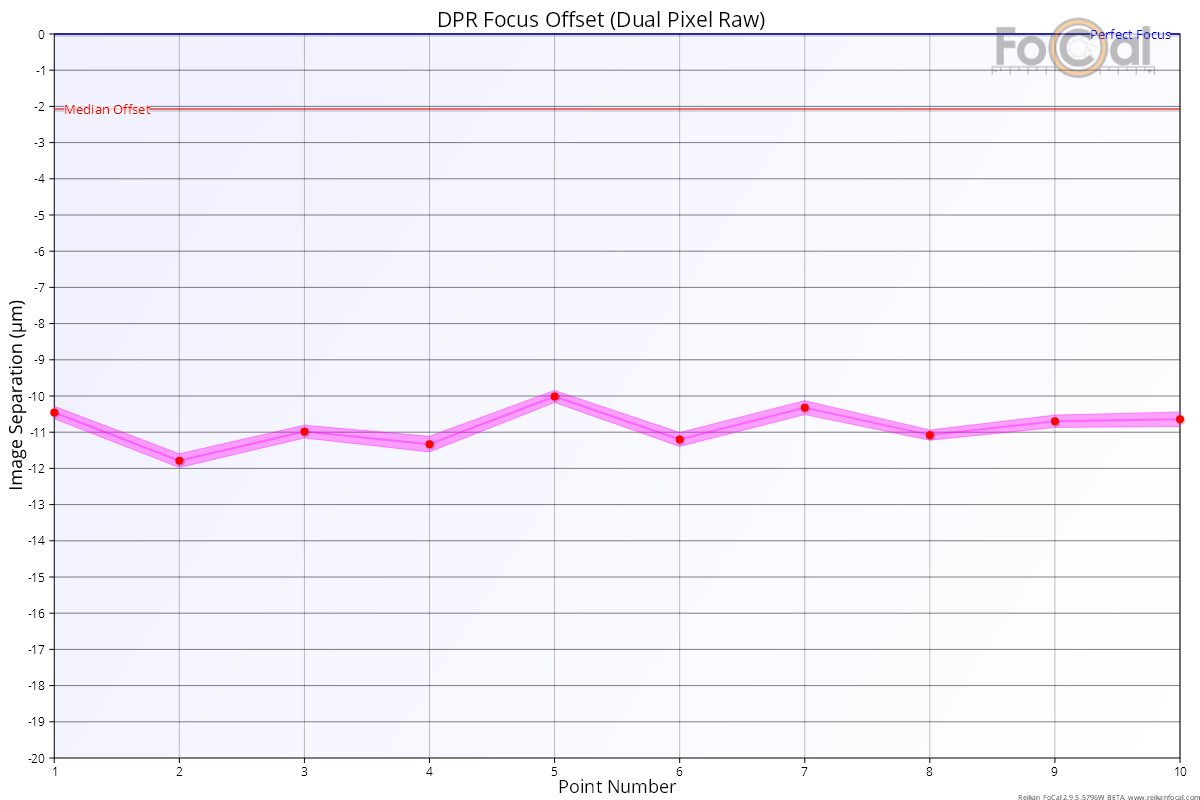
Example of poorly calibrated lens
This is an example of the same camera and lens as above, but incorrectly calibrated. You can see that there is an offset of over 10 microns (compared to fractions of a micron in the example above), indicated by the pink line being far away from the 0 value (blue line – “perfect focus” at the very top of the chart).
Quality of Focus – Focus Consistency | This Page