Details – Focus Consistency
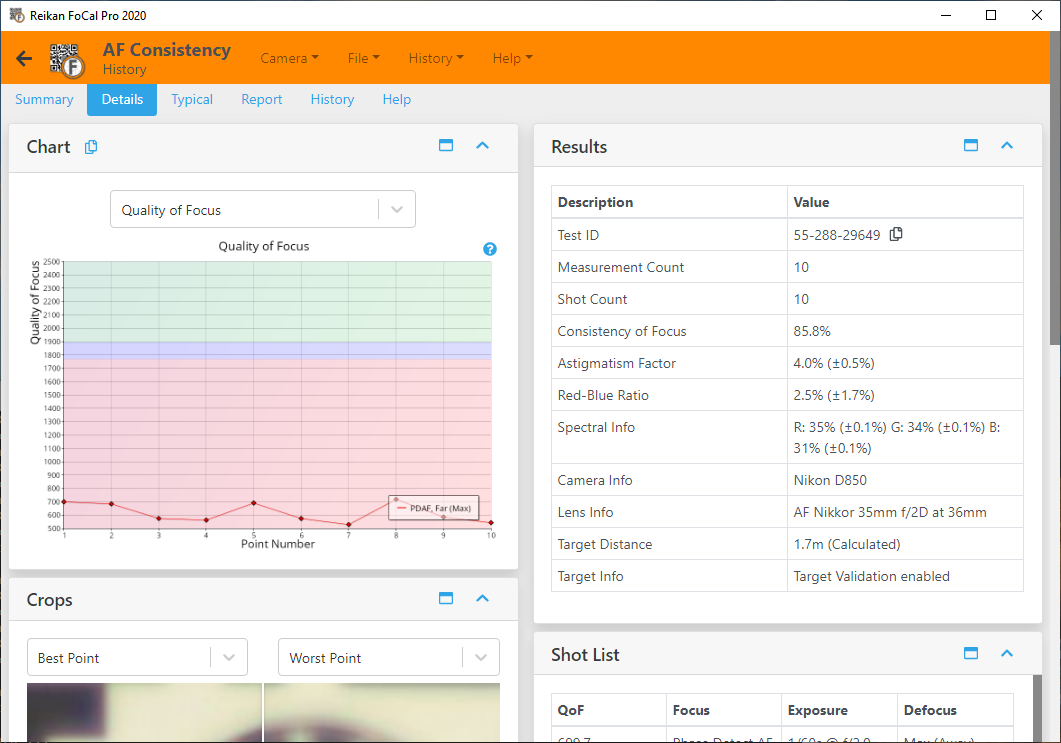
Test ID
A unique identifier for this particular test. You can use this when referencing the test – from within FoCal and if you have uploaded your results data from online* and with Reikan Support.
(* online features will be available in an upcoming release)
Measurement Count
The number of measurements calculated for this test. For the default settings this will be the same as the number of shots taken, but the settings can result in up to 4 shots per point (near defocus, far defocus for each of phase detect focus and live view focus).
Shot Count
This is the number of images the camera has captured for the test.
Consistency of Focus
Consistency of Focus is a measure of the closeness of the focus values across the test.
Ideal focus – if exactly the same image and focus point was obtained for each test point – would result in a value of 100%.
A value lower than around 98% is usually cause for interest. If the lighting is consistent and the environment stable, repeatable results less than around 98% may point to issues with your lens.
[FoCal Pro] You should use the FoCal Comparison Data red/blue/green overlays to make a judgement as to whether the measured results are expected for this lens.
Astigmatism Factor
Astigmatism Factor is a metric which indicates how the sharpness compares in two perpendicular axes of analysis. A value that deviates away from 0% can indicate asymmetrical lens distortion.
If the measure of sharpness in the horizontal direction is equal to the measure of sharpness in the vertical direction, the astigmatism factor will be 0%.
If the horizontal sharpness is higher than the vertical sharpness, the value will be above 0%, and if the vertical sharpness is higher than the horizontal sharpness, the value will be below 0%.
The percentage indicates how much sharper the sharpest axis is as a percentage. For example:
- if the horizontal measurement is 10% sharper than the vertical axis, the astigmatism factor would be +10%
- If the vertical measurement is 5% sharper than the horizontal axis, the astigmatism factor would be -5%
Red-Blue Ratio
This value indicates the quality measurement difference between the red and the blue channels. High values can indicate separation of colour channels (chromatic aberration) at the analysis region which would appear as fringing or false colouring.
If the measure of red quality is equal to the measure of blue quality the red-blue ratio will be 0%.
If the red quality is higher than the blue quality, the value will be above 0%, and if the blue quality is higher than the red quality, the value will be below 0%.
The percentage indicates how much higher the best quality is compared to the other. For example:
- if the red quality is 10% higher than the blue quality, the value would be +10%
- If the blue quality is 5% sharper than the red quality, the value would be -5%
Spectral Info
This value indicates the spectral content of the light used for analysis. Note that this will be the component powers (red, green, blue) as measured by the camera after image processing.
For JPEG modes, this value can be highly influenced by the internal processing engine of the camera.
For Raw, our processing compensates for per-channel attenuation from the colour filter array and tries to give a representative indication of actual lighting power, but accuracy will be dependent on how closely the selected colour temperature in the FoCal settings is to the actual lighting colour temperature.
Generally, this should just be used as an indication of approximately white lighting, with all three values around 33%. If one value is wildly away from 33% (e.g. >50% or <10%) any measurements are unlikely to be representative of “normal” shooting conditions.
Camera Info
This is information about the camera used for the testing, including temperature if available.
Lens Info
This is information about the lens used for the test, including focal length if available.
Target Distance
The calculated (by FoCal analysis of the target) or reported (from the camera) distance between the camera and the FoCal Target.
Note that distance calculation reports from the camera can be quite inaccurate. Also note that the Printed Target Size setting in FoCal Settings can alter the distance calculation results.
Target Info
Information about the target validation settings used for this test.
Target Validation confirms that the target is in the correct place, orientation etc and that nothing has significantly changed between shots.
Target Optimisation will make minor adjustments to the analysis position in order to compensate for any small movement of the image due to lens defects etc.