Dust Spot Opacity – Dust Analysis
The Dust Spot Opacity chart displays all detected high-confidence dust spots. 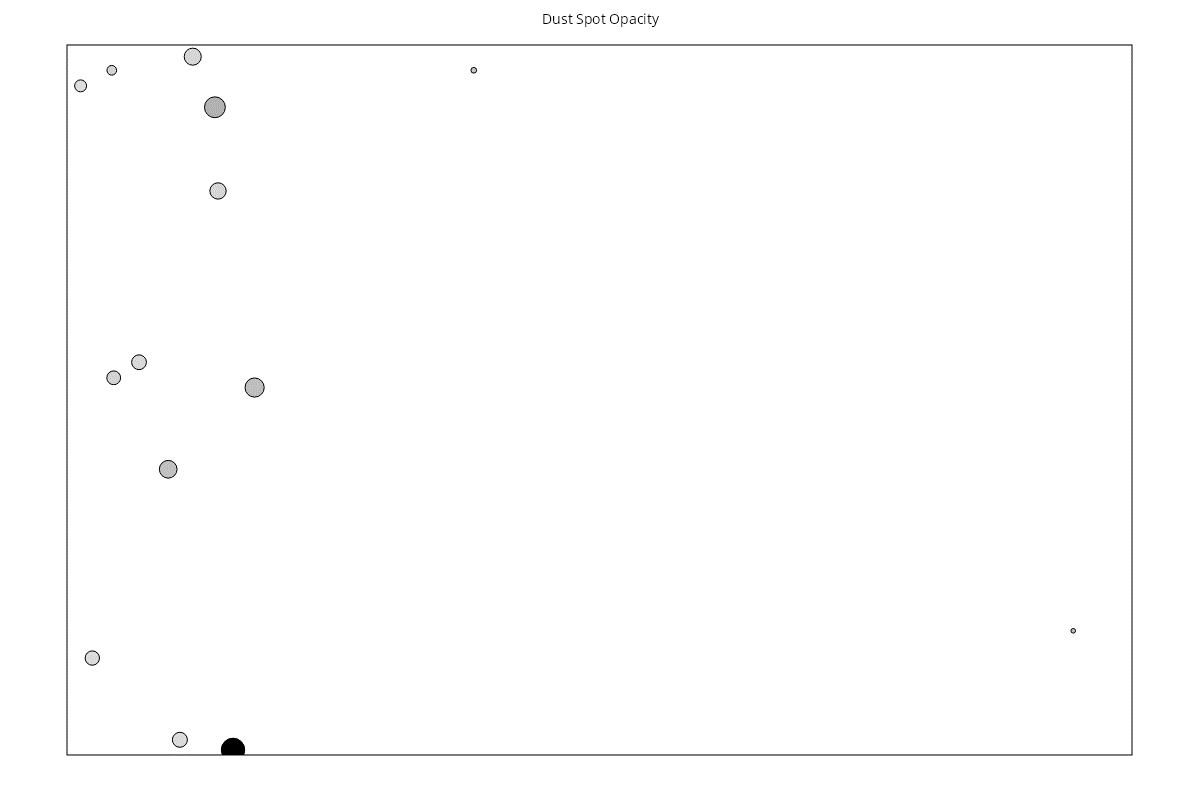
Key:
- Circles indicate dust spots.
- Size is much larger but proportional to the dust spot size.
- Darkness of the spots indicates how opaque the spots appear in the image.
Basic Interpretation
The Dust Spot Opacity chart displays all detected high-confidence dust spots. Detected spots are filtered by aperture, so if they do not appear in the same place over a range of apertures they will be ignored.
The size of each displayed dust spot is relative to the detected size of the spot. Note that the spots shown on this chart are considerably larger than real life in order to make them easier to see.
The darkness of each spot indicates the maximum detected opacity of the spots on the sensor. A spot on the chart closer to black indicates a darker spot on the sensor. The opacity value used is the most opaque spot in this location detected across the whole aperture range.