Quality Ratio – Calibration Check
(See Chart Features for general chart features - changing scales, copying to clipboard etc)
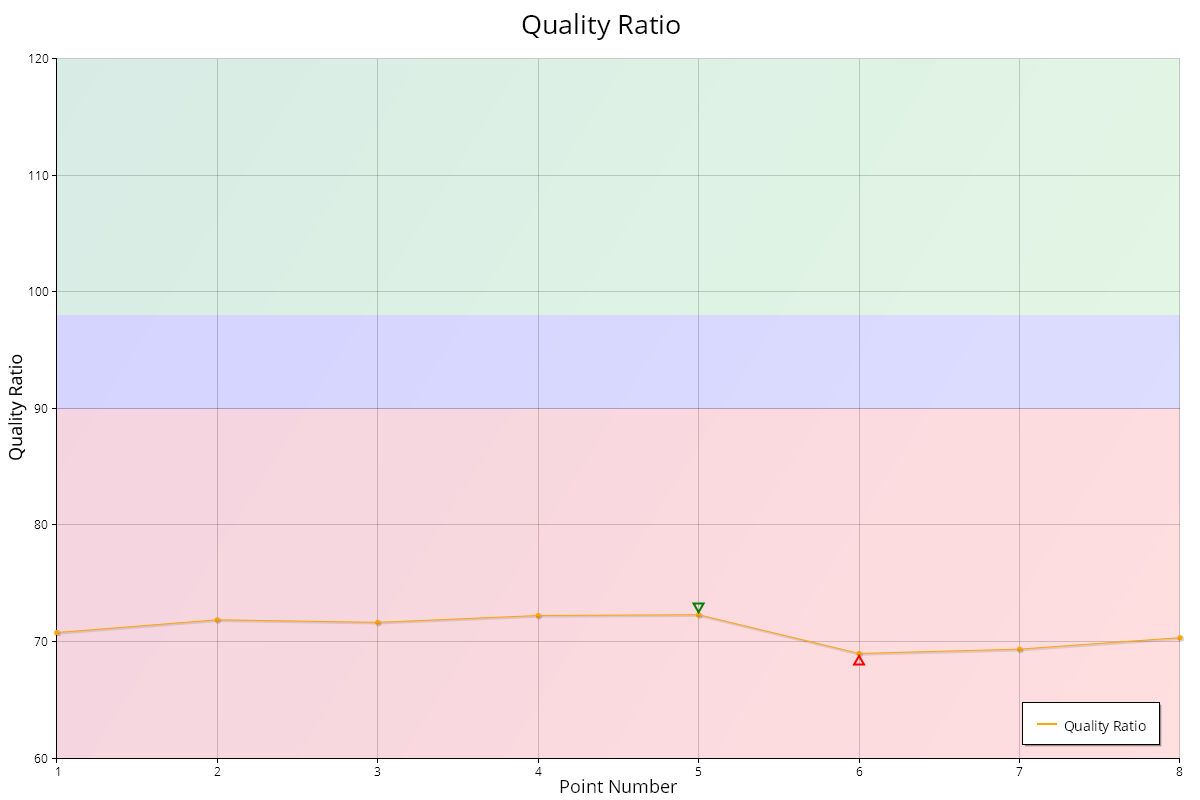
The Quality Ratio chart shows the difference in quality between the Live View and non-Live View (phase detect) measurements at each point.
A value below 100% shows that contrast detect quality is better, above 100% shows that phase detect quality is better.
Key:
- Orange line: Quality Ratio measurements
- Green area: lens does not require calibration
- Blue area: lens is performing well, but may benefit from checking
- Red area: lens requires calibration
Interpretation
A well calibrated lens should show most points within the blue or green area.
This Page | Quality Value – Calibration Check