Red Quality – MultiTest
(See Chart Features for general chart features - changing scales, copying to clipboard etc)
The Red Quality chart shows the difference between the sharpness in the red channel and the sharpness in the green channel.
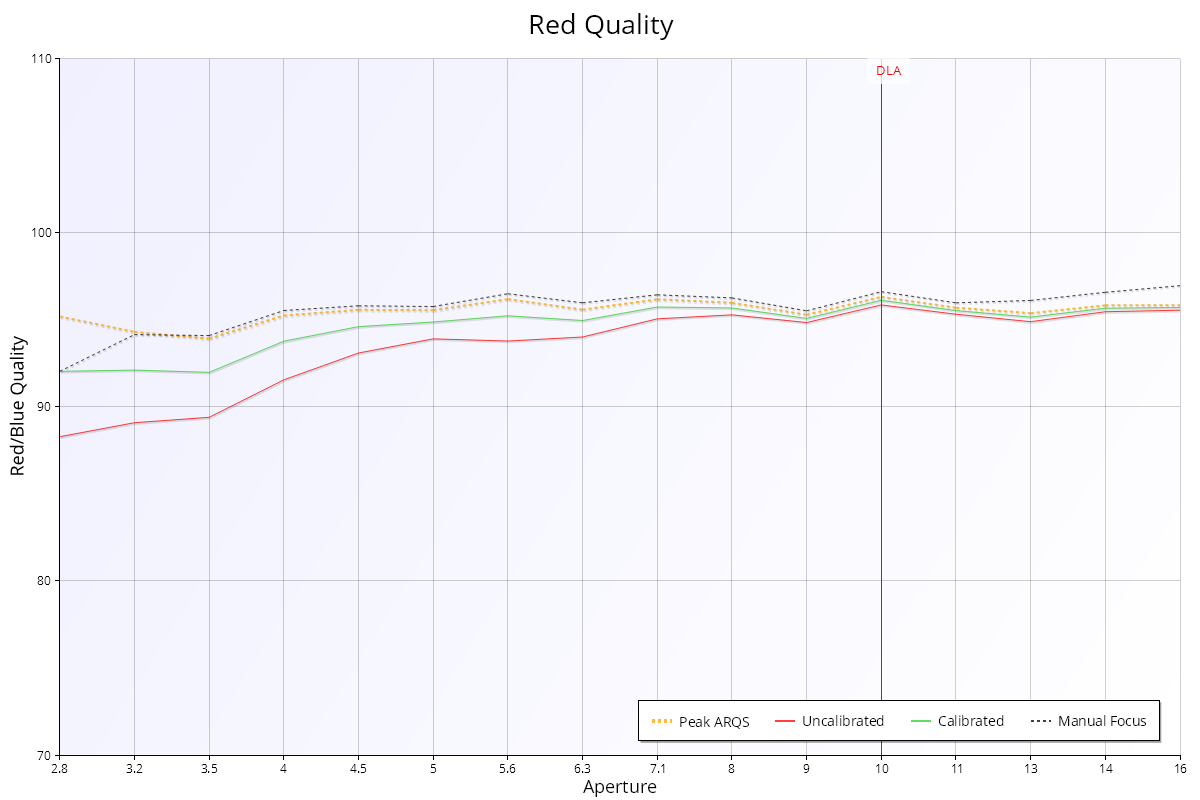
- Red line: uncalibrated red quality (adjustment value is 0)
- Green line: calibrated red quality
- Black dotted line: red quality with manual focusing at any aperture
- Orange dotted line: red quality at ARQS calibration value (see Aperture Range Quality Score (ARQS) – MultiTest).
Interpretation
See Red-Blue Ratio – MultiTest for an introduction to aberrations.
This chart shows the quality in the red channel, normalised to the green channel as a reference.
A value below 100% is expected and shows that the quality of the red channel is less than the quality of the green channel.
If the value goes above 100%, it indicates that the red image is sharper than the green image.
Red-Blue Ratio – MultiTest | This Page | Blue Quality – MultiTest