Handheld Effectiveness – Stabilisation Test
(See Chart Features for general chart features - changing scales, copying to clipboard etc)
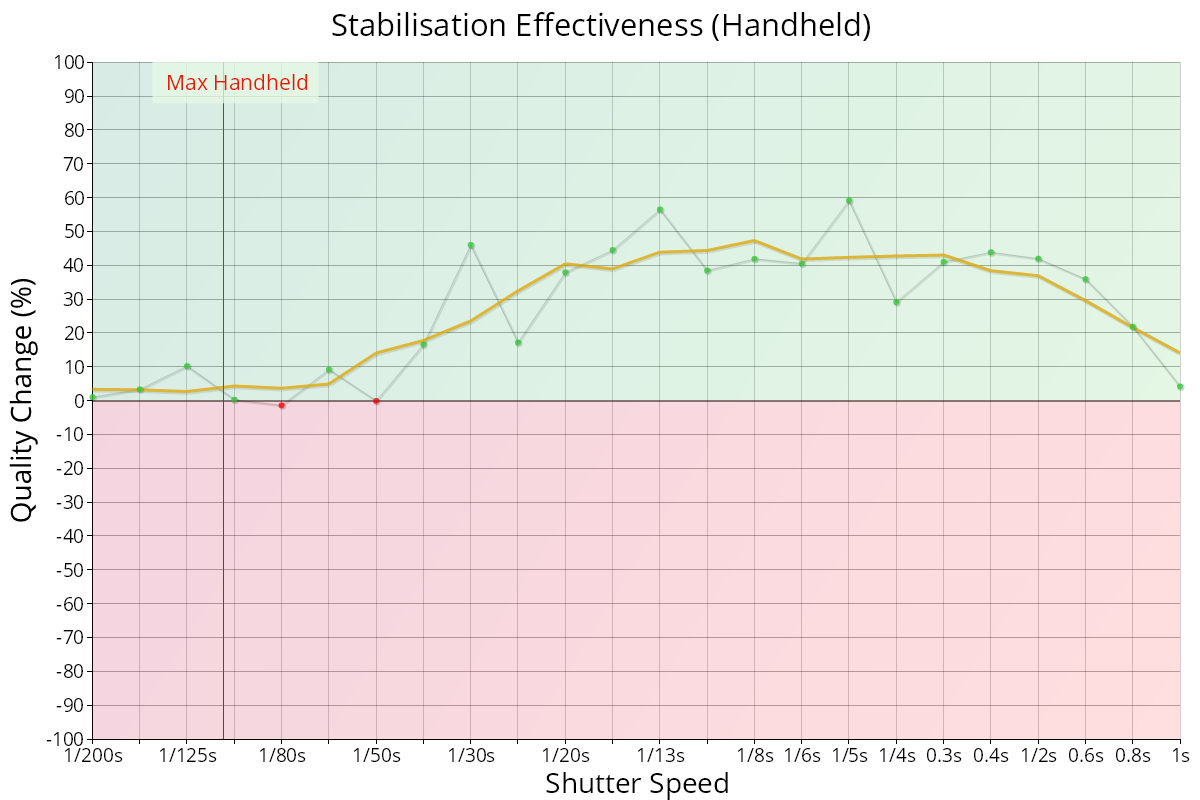
The Handheld Effectiveness chart shows the difference between the quality measurements (as a percentage) when the stabilisation system is on and off.
Key:
- Orange line: smoothed percentage improvement across the shutter speed range
- Green line: raw percentage improvement measured at each shutter speed
- Green markers: points where the quality is improved with stabilisation enabled.
- Red markers: points where quality is degraded with stabilisation enabled.
Interpretation
This chart effectively shows the quality improvement (or degradation) when the stabilisation system is enabled.
In the example above, you can see that there is very little improvement with the system enabled up until around 1/60s, then the improvement rises across the shutter speed range.
Quality – Stabilisation Test | This Page | Tripod Effectiveness – Stabilisation Test