Red-Blue Quality – Aperture Sharpness
(See Chart Features for general chart features - changing scales, copying to clipboard etc)
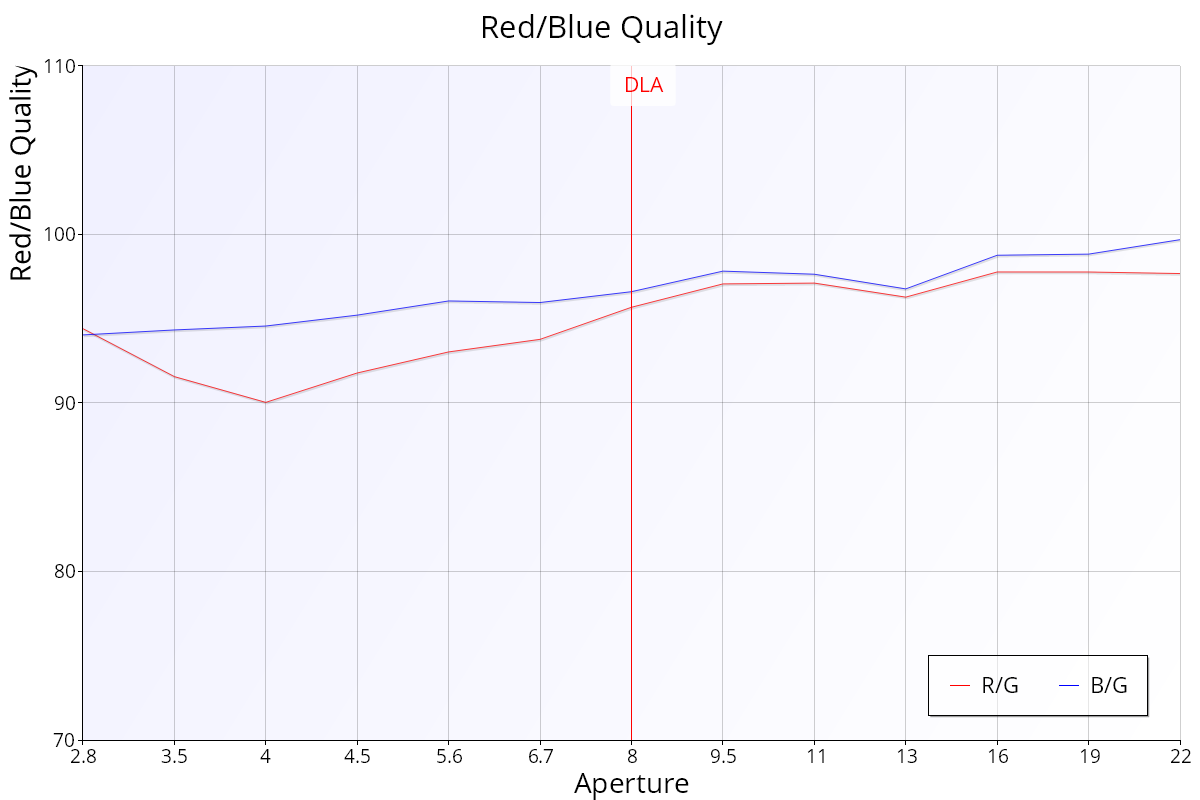
The Red-Blue Ration gives a view of the image quality difference of the between the red- and -blue channels when compared to the green channel.
Key:
A value higher than 100 indicates that the red- or blue- quality is higher than the green quality.
A value lower than 100 indicates that the red- or blue- quality is lower than the green quality.
Basic Interpretation
Ideally, a lens will focus all colours to the same point on the camera sensor, but in reality, this does not happen perfectly. More expensive lenses with dispersion correction elements (aspherical, fluorite etc) will do a better job of focusing the various wavelengths of light.
This chart normalises the red and green quality values against the green value. Most autofocus systems will try to obtain perfect focus for the green channel (as our eyes are most sensitive to green this makes sense). By normalising the red or blue channels to green, this removes general shot-to-shot variation and allows a direct comparison between red and blue qualities.
Note that this chart does not indicate the absolute sharpness, just the ratio between the red-vs-green and blue-vs-green blue values.
Red-Blue Ratio – Aperture Sharpness | This Page | Comparison Data Difference – Aperture Sharpness