Image Motion – MultiTest
(See Chart Features for general chart features - changing scales, copying to clipboard etc)
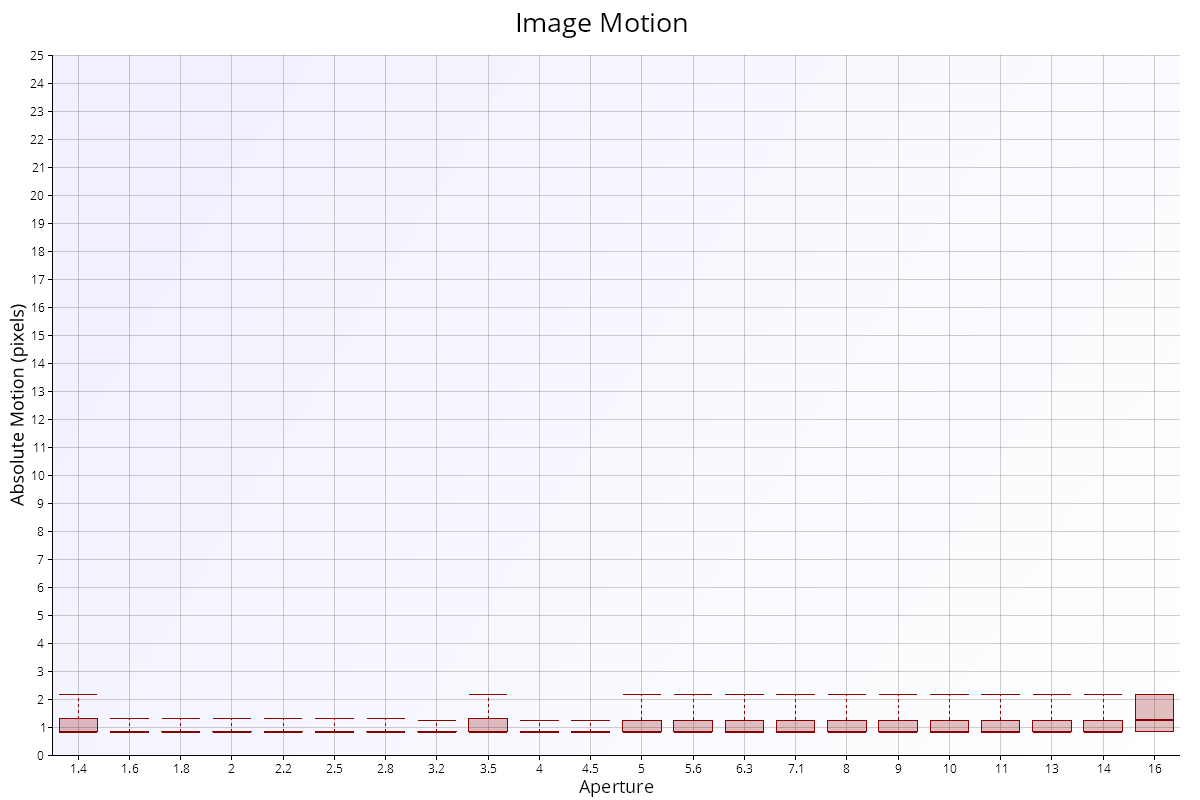
The Image Motion chart shows the way a point in the captured images changes across the aperture range.
Key:
The data is shown in a classic box-plot format:
- The bars at the top and bottom of each point represent the full extremes of the image motion
- The box in the middle shows the extent of the middle 50% of data points (the interquartile range)
- The thicker bar somewhere within the box shows the median value.
Interpretation
The highest and lowest “whiskers” indicate the extremes of image motion.
The box represents the middle 50% of the data, so shows the typical image motion at any point.
The thicker bar in the centre shows the median (which is the middle value if all values were organised in order).
The data above shows that the typical image motion is around or slightly less than 1 pixel as you change aperture.
If the image motion across the range is higher than around 3-5 pixels, it can indicate internal lens alignment issues or problems with the aperture mechanism of the lens.
Blue Quality – MultiTest | This Page | Corner Brightness Profile – MultiTest