Stops Improvement – Stabilisation Test
(See Chart Features for general chart features - changing scales, copying to clipboard etc)
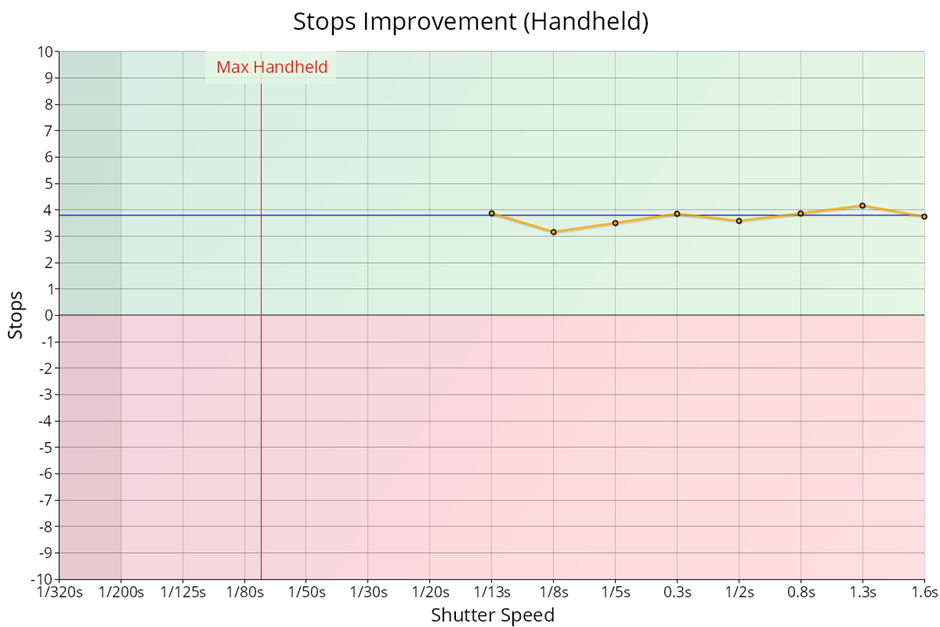
The Stops Improvement chart gives an idea of the overall performance of the stabilisation system measured in stops.
Key:
- Orange line: number of stops between similar quality points with stabilisation enabled and disabled. The specified shutter speed is the speed with stabilisation enabled.
- Blue line: median stops improvement across the whole shutter speed range.
In the example above, taking 1/2s as an example, this shows an improvement of just around 4 stops, which means 1/2s exposure with stabilisation enabled should give the same sort of quality as 1/30s exposure with stabilisation disabled (a 4 stop improvement).
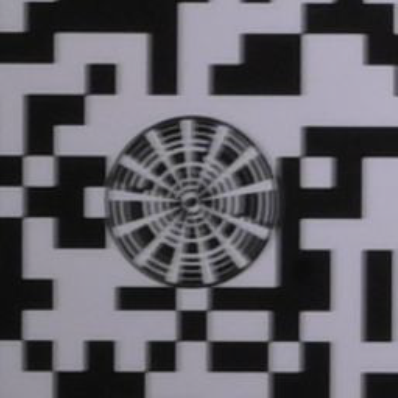
Just to show exactly what this looks like, here are some crops from the test that the chart above was taken from. On the left, you have a 1/30s exposure with VR disabled, and on the right a 1/2s exposure (4 stops slower) with VR enabled – they’re not identical, but they are pretty similar quality:
| 1/30s exposure with VR disabled | 1/2s exposure with VR enabled |
|
|
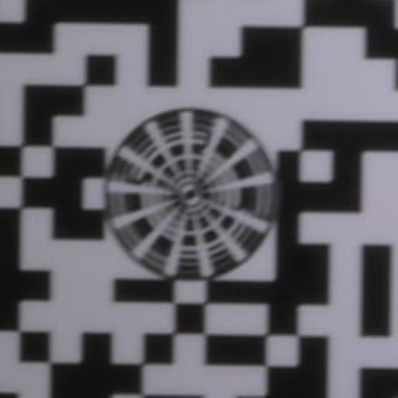
And here is the 1/2s exposure with VR disabled for comparison:

Absolute H/V Ratio Difference – Stabilisation Test | This Page | Image Motion – Stabilisation Test