Absolute H/V Ratio Difference – Stabilisation Test
(See Chart Features for general chart features - changing scales, copying to clipboard etc)
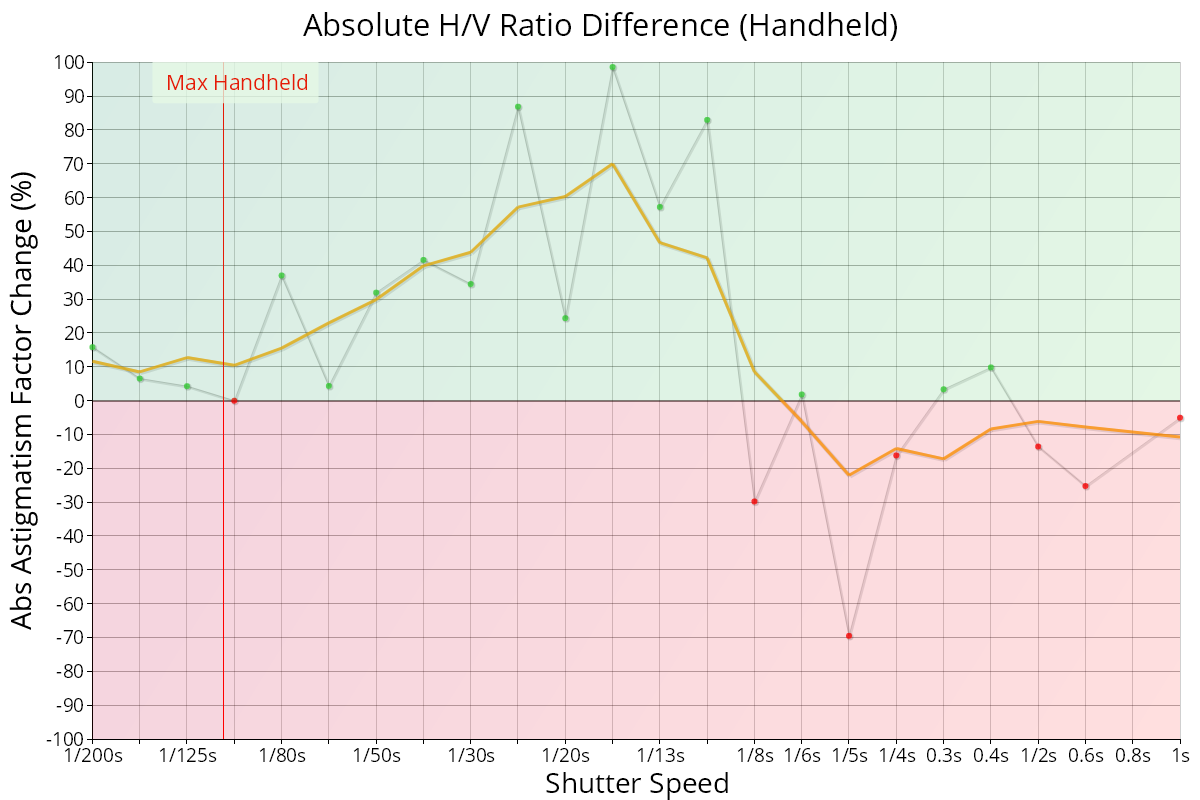
The Absolute H/V Ratio Difference chart shows the difference between the absolute H/V ratio with the stabilisation system enabled and disabled.
Key:
- Orange line: the difference in absolute H/V Ratio with the stabilisation system enabled and disabled.
- Green points: raw measurements where Absolute H/V Ratio is lower (better) with the stabilisation system enabled.
- Red points: raw measurements where Absolute H/V Ratio is higher (worse) with the stabilisation system enabled.
Interpretation
As explained in Absolute H/V Ratio – Stabilisation Test, the absolute H/V ratio shows the size of the quality difference between the horizontal and vertical analysis.
This chart shows the difference in this value with stabilisation enabled and disabled.
A values above 0 indicates that the Absolute H/V Ratio values is lower (better) when stabilisation is enabled.
The chart above shows a good improvement in absolute H/V ratio between around 1/70s and 1/8s, showing the stabilisation system is working well during these shutter speeds.
Tripod Chart
The tripod data from the same test is as follows:
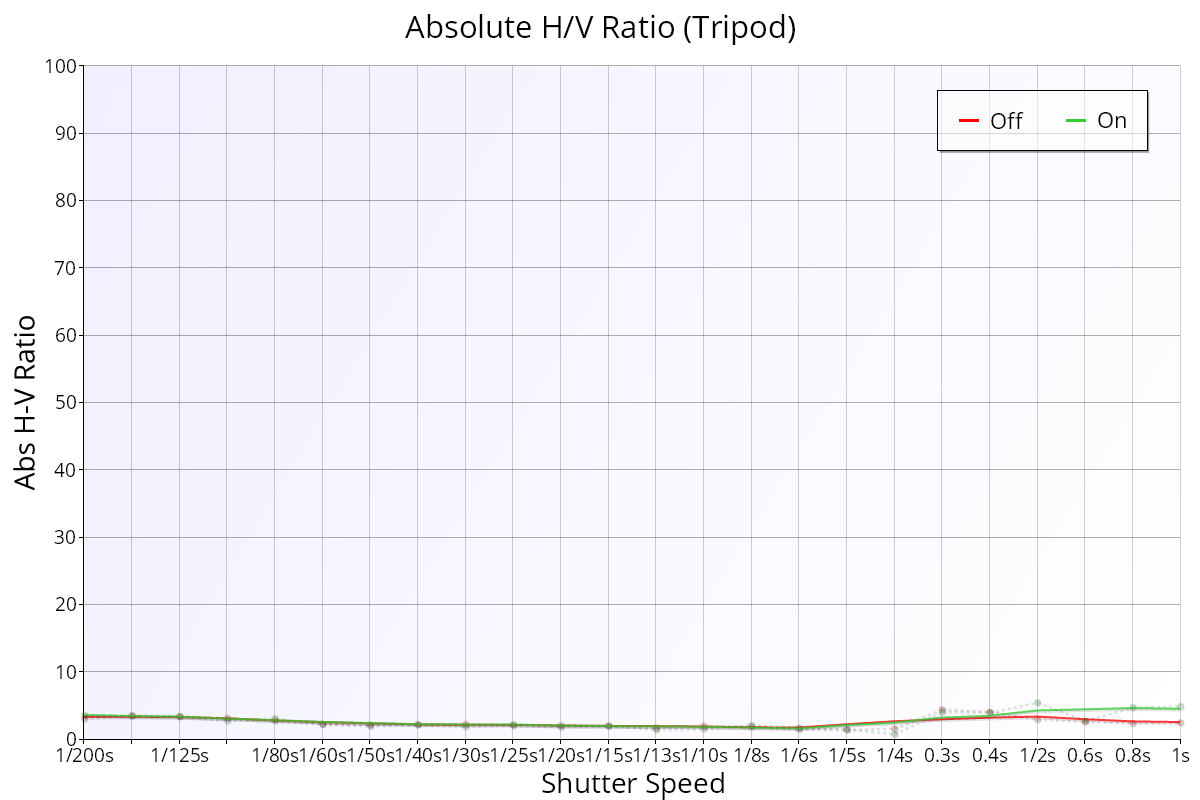
From around 1/2s, the Absolute H/V Ratio is larger (worse) with stabilisation enabled when on a tripod, so it would be worth ensuring that the system is OFF when mounted on a tripod at these speeds.
Absolute H/V Ratio – Stabilisation Test | This Page | Stops Improvement – Stabilisation Test