Absolute H/V Ratio – Stabilisation Test
(See Chart Features for general chart features - changing scales, copying to clipboard etc)
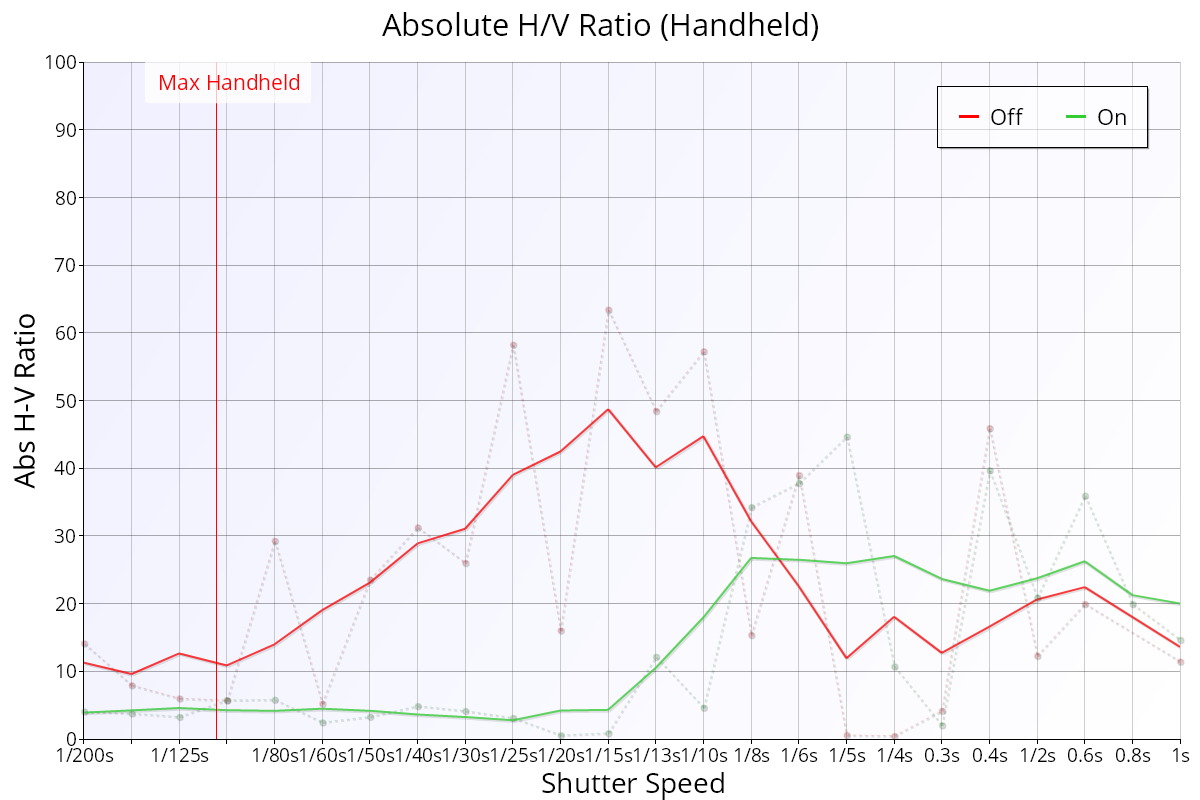
The Absolute H/V Ratio chart shows a comparison between the horizontal and vertical analysis quality but ignores which axis is better quality.
Key:
- Green line: smoothed H/V Ratio with stabilisation enabled.
- Red line: smoothed H/V Ratio with stabilisation disabled.
- Green points/dotted line: raw H/V Ratio with stabilisation enabled.
- Red points/dotted line: raw H/V Ratio with stabilisation disabled.
Interpretation
Where H/V Ratio (H/V Ratio – Stabilisation Test) shows which axis is sharper, the Absolute H/V Ratio simply shows the magnitude of the difference between the horizontal and vertical analysis, which can give a clearer indication of general quality degradation.
The value is always positive. A higher value indicates a bigger difference in quality that’s measured rotated by 90 degrees.
The important thing in the chart above is the step change in difference when stabilisation is enabled, starting around 1/15s. This indicates that the quality is impaired – even with stabilisation enabled – by around 1/8s.
H/V Ratio – Stabilisation Test | This Page | Absolute H/V Ratio Difference – Stabilisation Test