H/V Ratio – Stabilisation Test
(See Chart Features for general chart features - changing scales, copying to clipboard etc)
The H/V Ratio chart shows a comparison between the horizontal and vertical analysis quality.
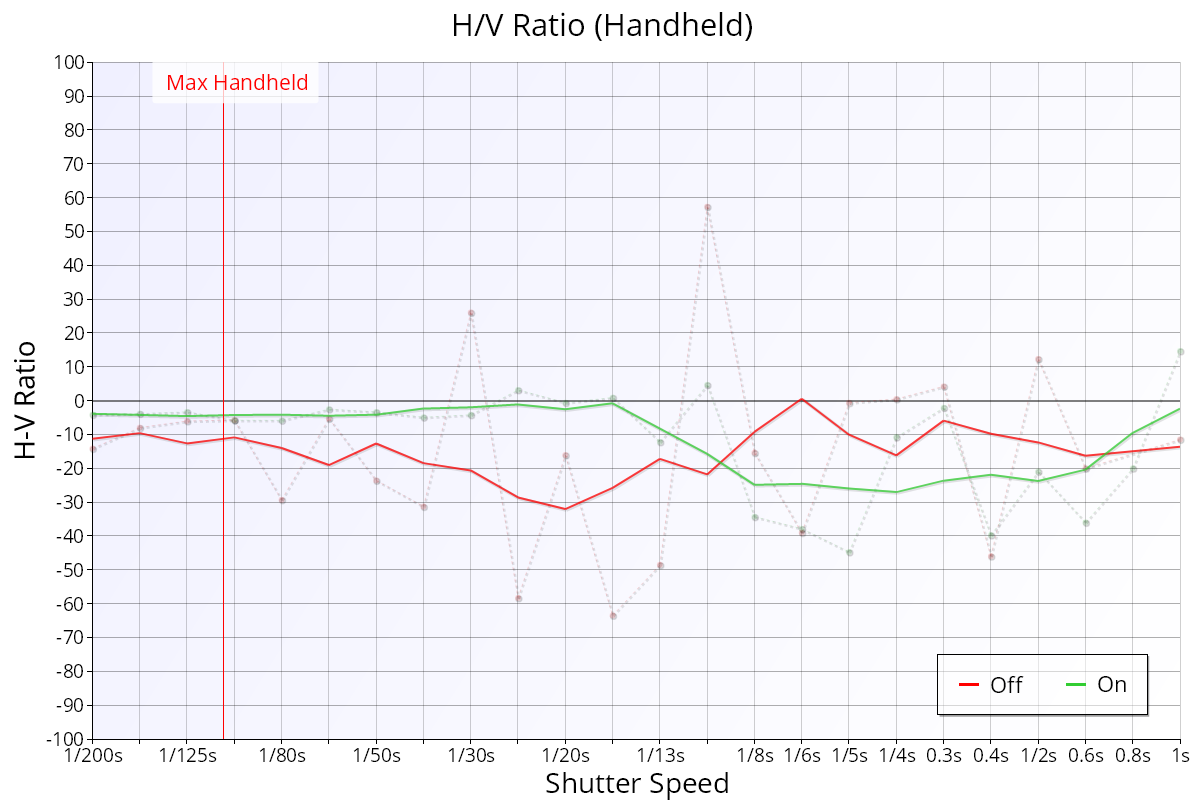
Key:
- Green line: smoothed H/V Ratio with stabilisation enabled.
- Red line: smoothed H/V Ratio with stabilisation disabled.
- Green points/dotted line: raw H/V Ratio with stabilisation enabled.
- Red points/dotted line: raw H/V Ratio with stabilisation disabled.
Positive values: indicates that the horizontal axis has a higher quality, which may indicate vibration in the vertical axis.
Negative values: indicates that the vertical axis has a higher quality, which may indicate extra motion in the horizontal axis.
Interpretation
H/V ratio is an indication of the sharpness difference between horizontal and vertical analysis, and can show effects of vibration in one axis.
A value of H/V ratio above 0 indicates that the image is sharper in the horizontally, which can indicate that there is blurring/vibration in the vertical axis.
In the example chart shown above, the important point to notice is the comparison between the stabilisation Off and stabilisation On results. With stabilisation Off, the red line shows varying negative H/V ratio, averaging around -15, but this value will strong depend on how the camera was held. But notice the step-change in the stabilisation On (green line) at around 1/13s, indicating this is a point where the stabilisation system was beginning to fail to compensate for horizontal movement.
The values being all-negative shows that the vertical analysis was sharper than horizontal, i.e. the left-right movement was larger than up-down movement, which is typical for a solid hand-held grip of a camera.
Tripod View
Looking at the Tripod view of the data from the same test:
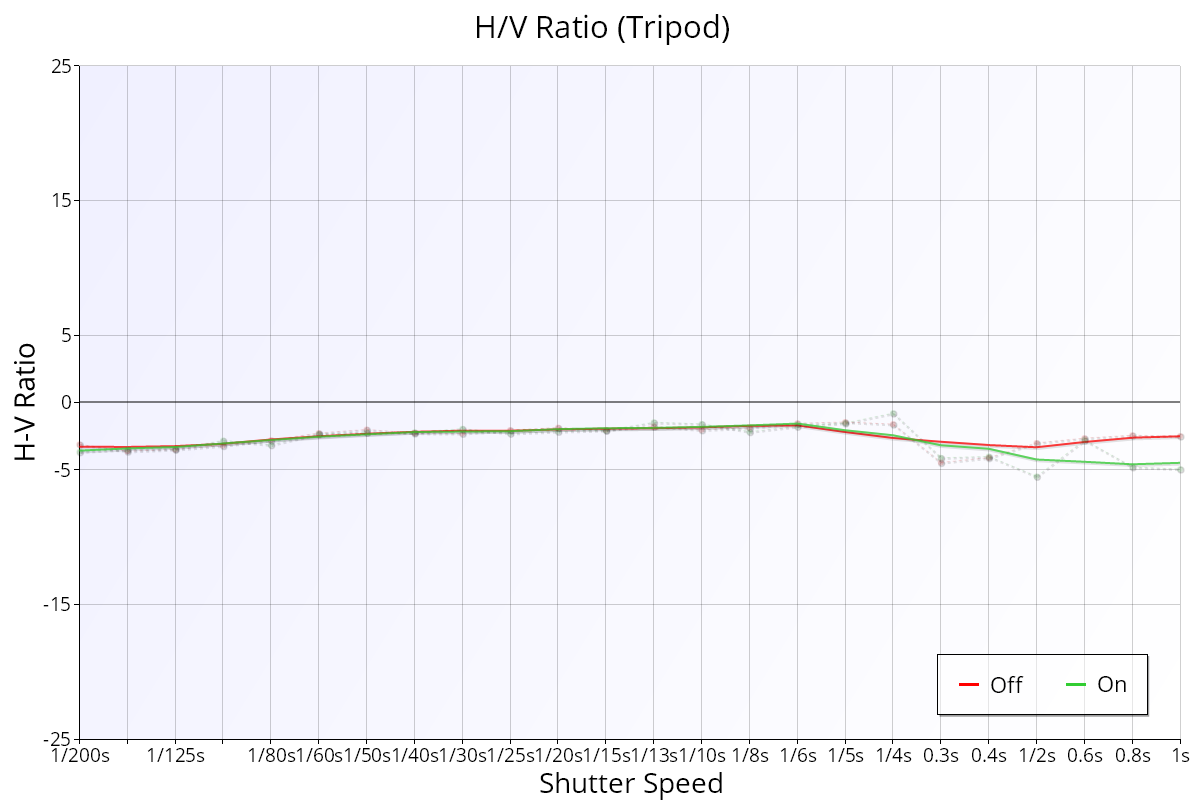
We can see an average H/V ratio around -4%, showing that the image is naturally a little sharper in the horizontal axis than in the vertical axis. This is not unusual and will be shown in tests like AF Consistency and Aperture Sharpness as Astigmatism Factor.
Towards the right end, we can see a divergence in the values for the stabilisation system being on and off, with the value slightly larger (further from the 0 line) when the system is enabled, suggesting that the stabilisation system should not be used on a tripod past about 0.4s or the image quality will start to be degraded when enabled.
Tripod/Handheld Difference – Stabilisation Test | This Page | Absolute H/V Ratio – Stabilisation Test