Image Motion – Aperture Sharpness
(See Chart Features for general chart features - changing scales, copying to clipboard etc)
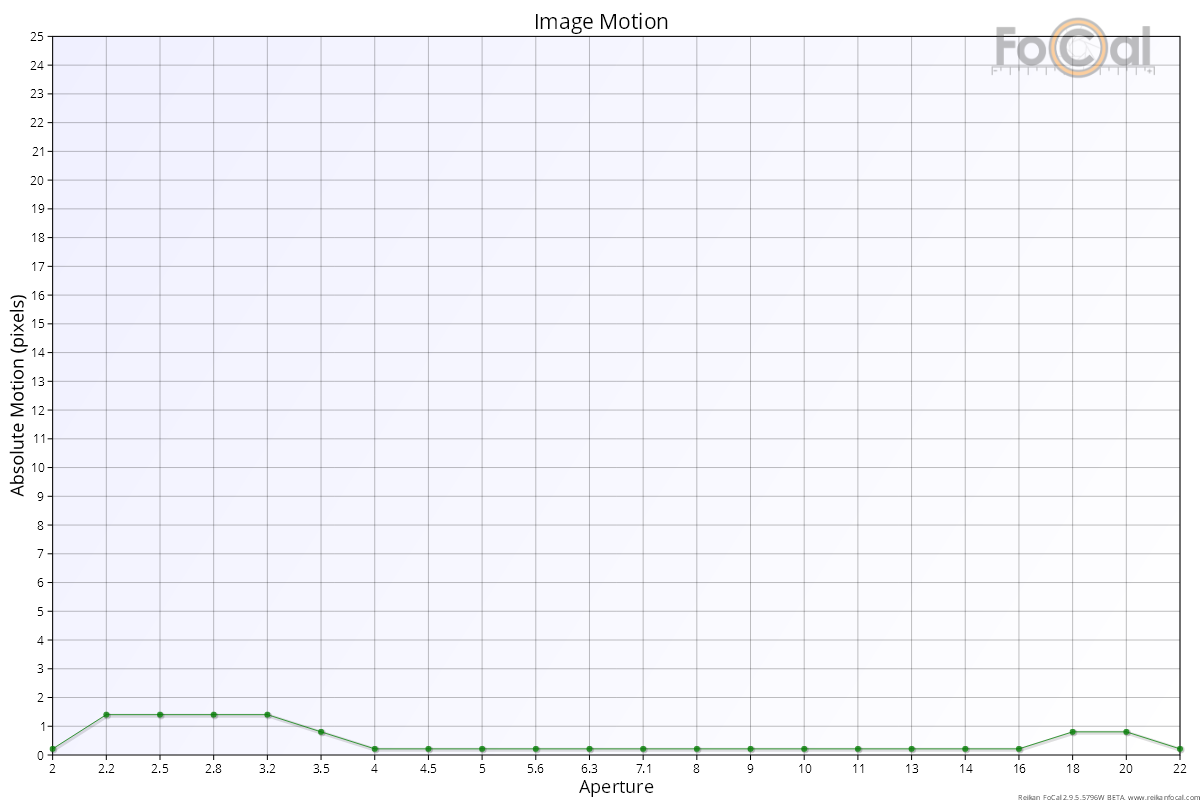
The Image Motion chart shows how the image of the FoCal target moves across the image sensor as the test is run.
Key:
- Green circles - image motion (in pixels) for individual shot
- Green area - the range of motion for all shots at each aperture
Basic Interpretation
As the aperture of the lens is changed, the image projected onto the sensor can move slightly. A high-quality lens in good condition should not exhibit large amounts of movement as the aperture changes, so this chart can be useful to detect any issues related to aperture operation.
The Image Motion chart shows the absolute number of pixels moved for each image compared to the first image captured. This metric does not include a direction - simply the overall number of pixels the image has moved.
Typically, the Image Motion should be significantly less than 10 pixels, and a repeatable higher value could indicate misaligned lens optics, camera movement or vibration during the test or other environmental or lens issues.
The example above shows a good quality result, with movement of typically less than a single pixel.
Comparison Data Difference – Aperture Sharpness | This Page | Corner Brightness Profile – Aperture Sharpness