Lens Profile - Fully Auto Calibration
(See Chart Features for general chart features - changing scales, copying to clipboard etc)
What this shows
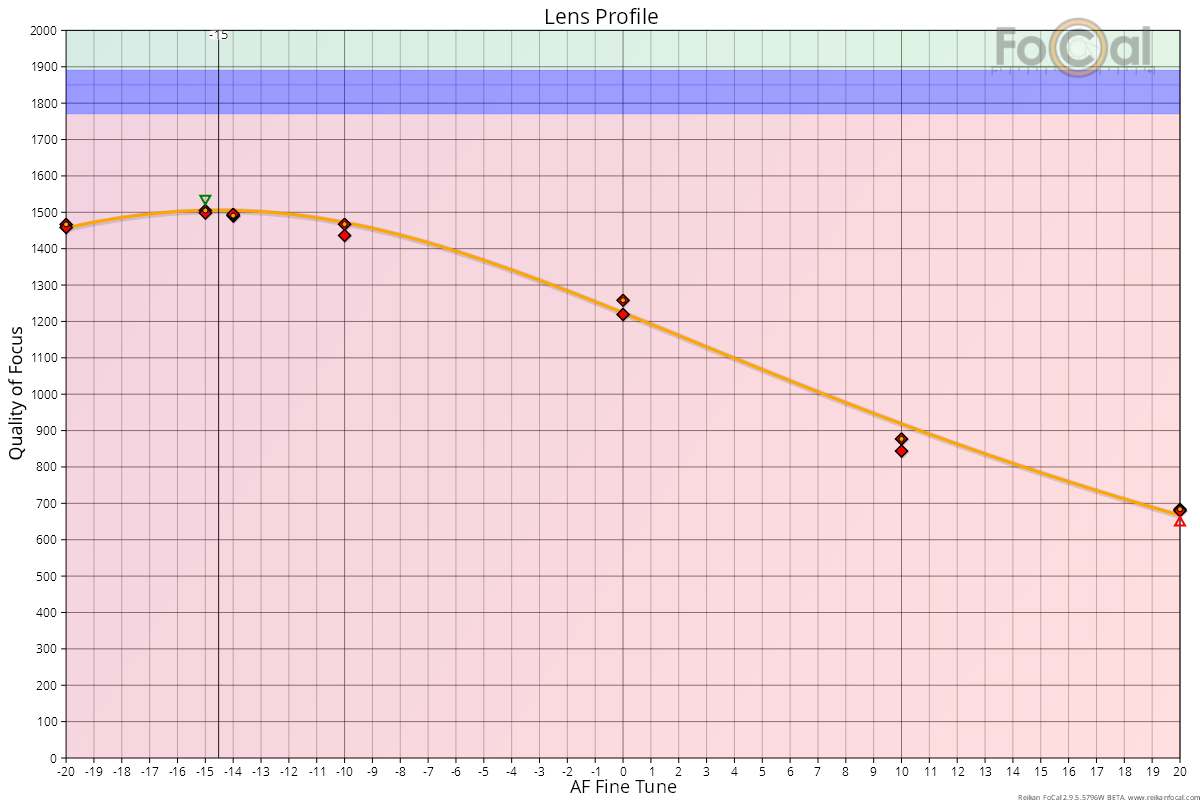
The Lens Profile chart shows how sharp your lens is at each Focus Adjustment value (AF Microadjustment, AF Fine Tune and so on). The highest point of the curve is the best calibration value. This is the main chart for a Fully Auto calibration.
How to read it
- Horizontal axis: the Focus Adjustment value, usually -20 to +20.
- Vertical axis: Quality of Focus (sharpness). Higher is sharper.
Key:
- Diamonds: the quality measured for each shot. Green diamonds were analysed with Target Optimisation on, red diamonds with it off.
- Circles: the representative (validated) quality FoCal uses at each Focus Adjustment value.
- Orange curve: the predicted sharpness across the whole range, fitted to the measurements.
- Green and red triangles: the highest and lowest measurements.
- Black vertical line: the calibration result, labelled with the value to set in your camera.
- Magenta vertical band labelled DPR: the Dual Pixel Raw result, when available (see below).
Where FoCal Comparison Data is available for your camera and lens, coloured bands show how the sharpness compares with other users:
- Green area: sharper than typical.
- Blue area: typical. The middle half of other users' results (between the first and third quartiles).
- Red area: less sharp than typical.
Compare only the peak of your curve with the bands. Points far from the result are out of focus, so they will always sit low.
What good looks like
- A smooth curve with a clear single peak, and measurements that sit close to it.
- The peak in the blue or green band, if comparison data is shown.
- The result well inside the camera's adjustment range.
In the example above, the best value is between -14 and -15 (the black line). All the measured points are in the red area, so this lens is less sharp than typical for this camera and lens.
If it looks wrong
- Points scattered widely at the same Focus Adjustment value: the autofocus is inconsistent, or the light or setup changed during the test. Check the setup with Target Setup, use steady light and a solid tripod, and run the test again. The Focus Consistency - Fully Auto Calibration chart shows this in detail.
- No clear peak, or the peak at the end of the range: the result may be outside the adjustment range, or the target was too far out of focus to measure at some values. Check the target distance and run the test again.
- The peak well into the red area: check the other charts and run another test before deciding the lens has a problem. One test on its own can be unusual.
Further Details
FoCal Comparison Data
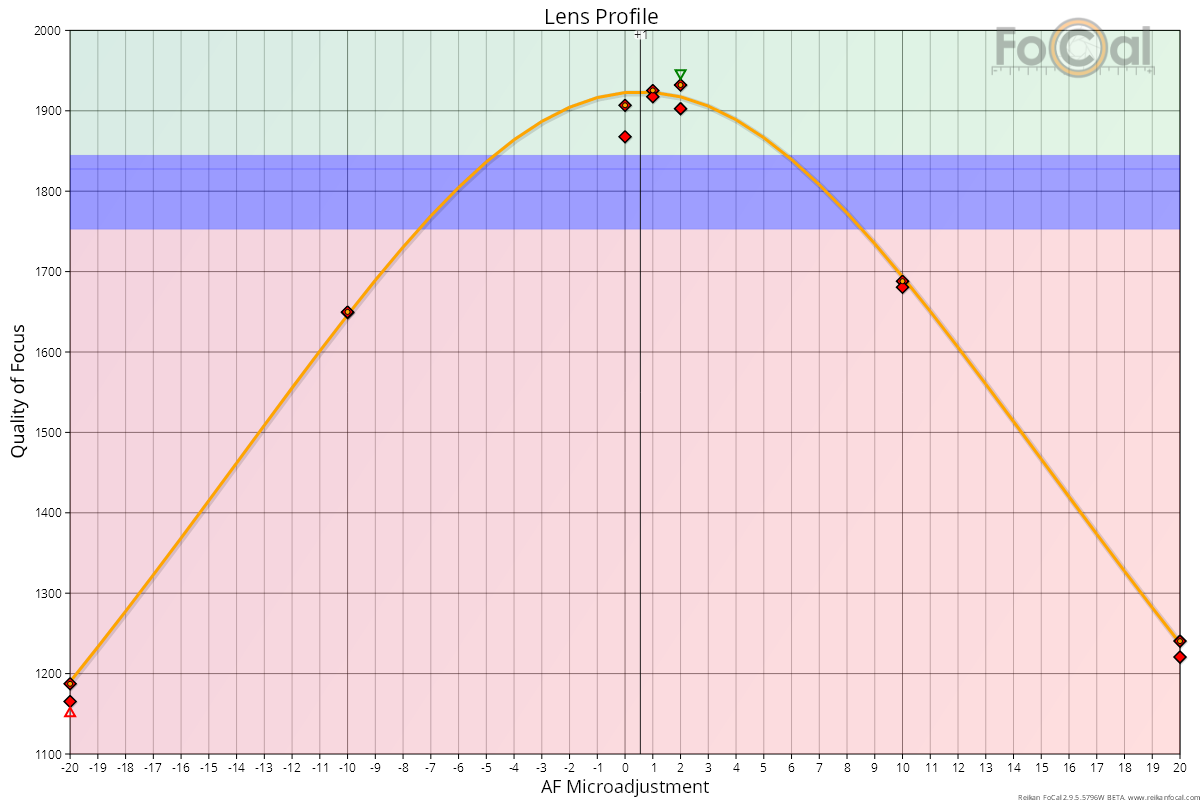
For a Fully Auto calibration, the bands show the quality of the best measurement in other users' tests. Compare the vertical position of your best point with the bands.
In the example below, the best points are in the green area. When calibrated, this lens is a little sharper than typical for this camera and lens. This is a good result:
In the example below, the peak is a long way down into the red area. This copy of the lens is quite poor:
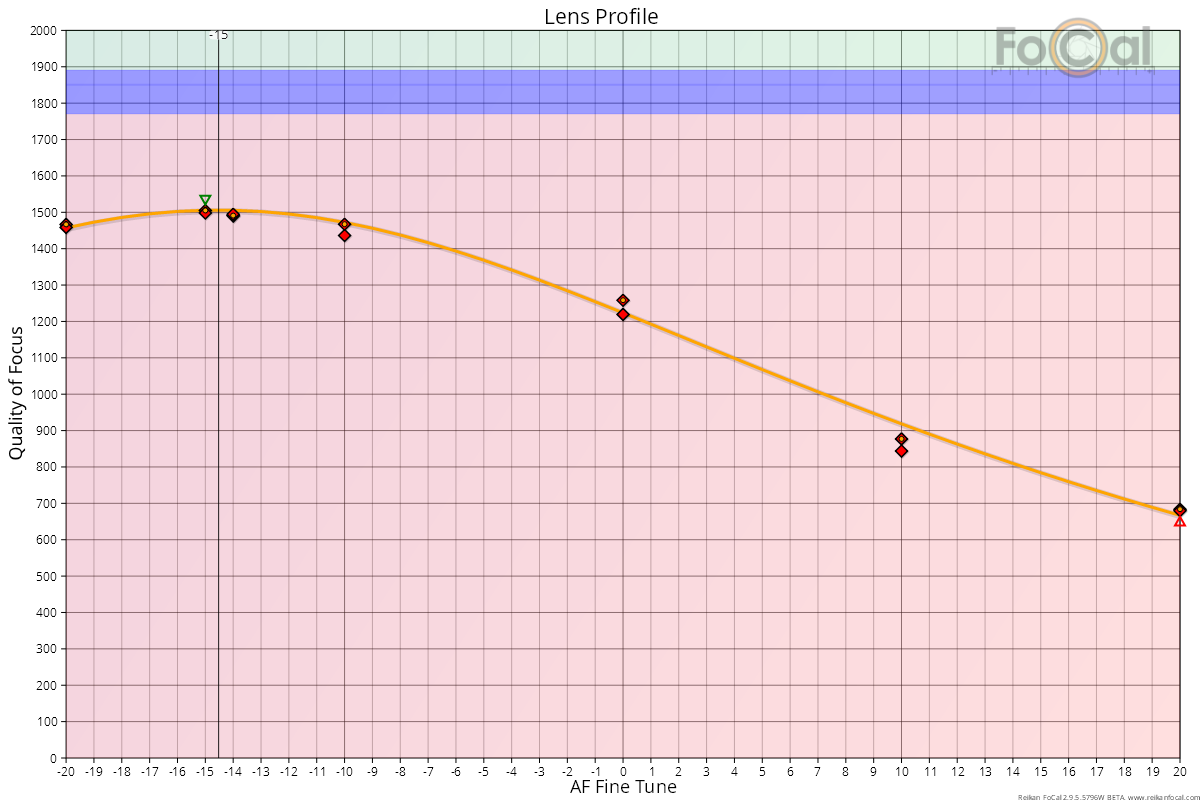
Check the results from other charts and tests to confirm the lens has a problem, rather than one unusual result.
Colour and direction channels (FoCal Pro)
Turn on Show RGBHV analysis data on the FoCal Pro tab of Settings. A Channel list then appears with the chart. Choose a single channel (Combined, Red, Green, Blue, Horizontal or Vertical), or All to see every channel at once:
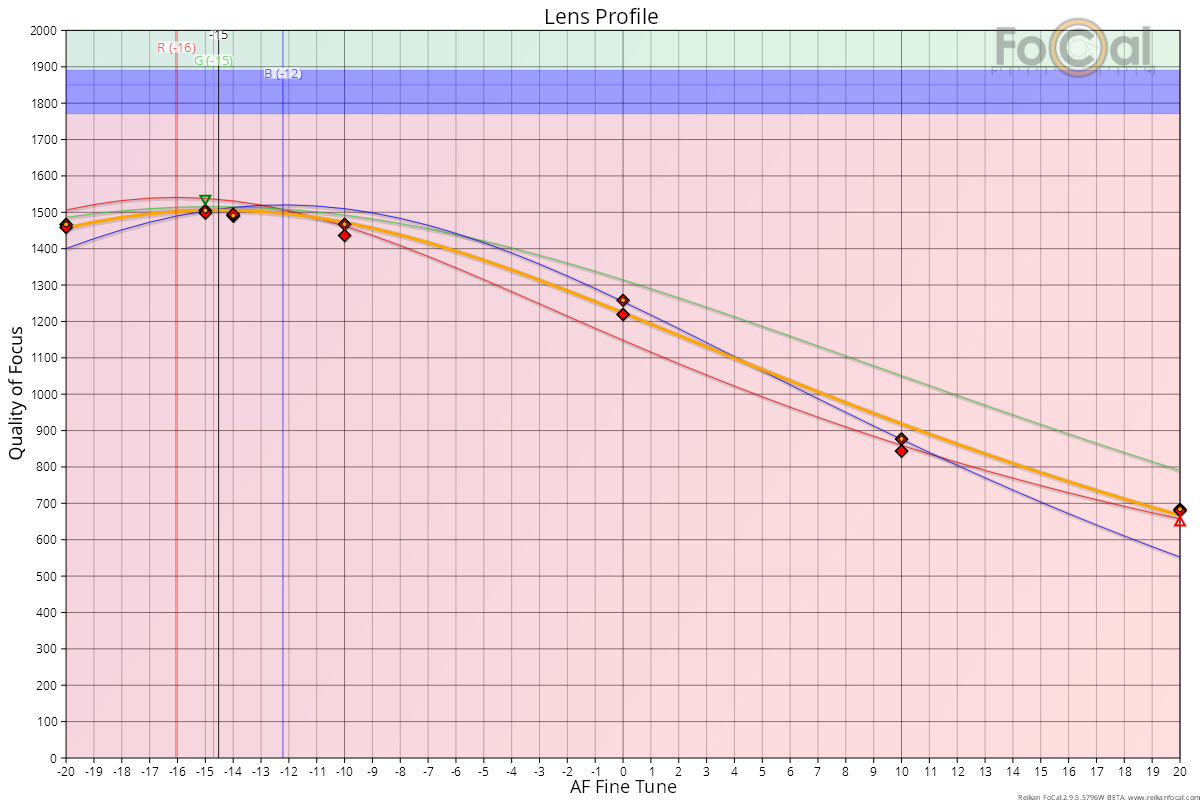
With All, the chart adds a curve for each colour (red, green and blue) and each analysis direction (yellow for horizontal, black for vertical). Coloured vertical lines labelled R, G, B, H and V show the result for each channel, when that channel's curve fits the data well.
Channel results can help if a lens has a lot of chromatic aberration, or if you shoot under unusual lighting.
Colour channels are only approximate in JPEG mode, because the colours can't be fully separated in a JPEG. For detailed colour analysis, test in Raw mode. FoCal's own raw converter separates the red, green and blue information completely.
Dual Pixel Raw
If Dual Pixel Raw is enabled in FoCal and on a supported camera, FoCal also analyses the dual pixel data:
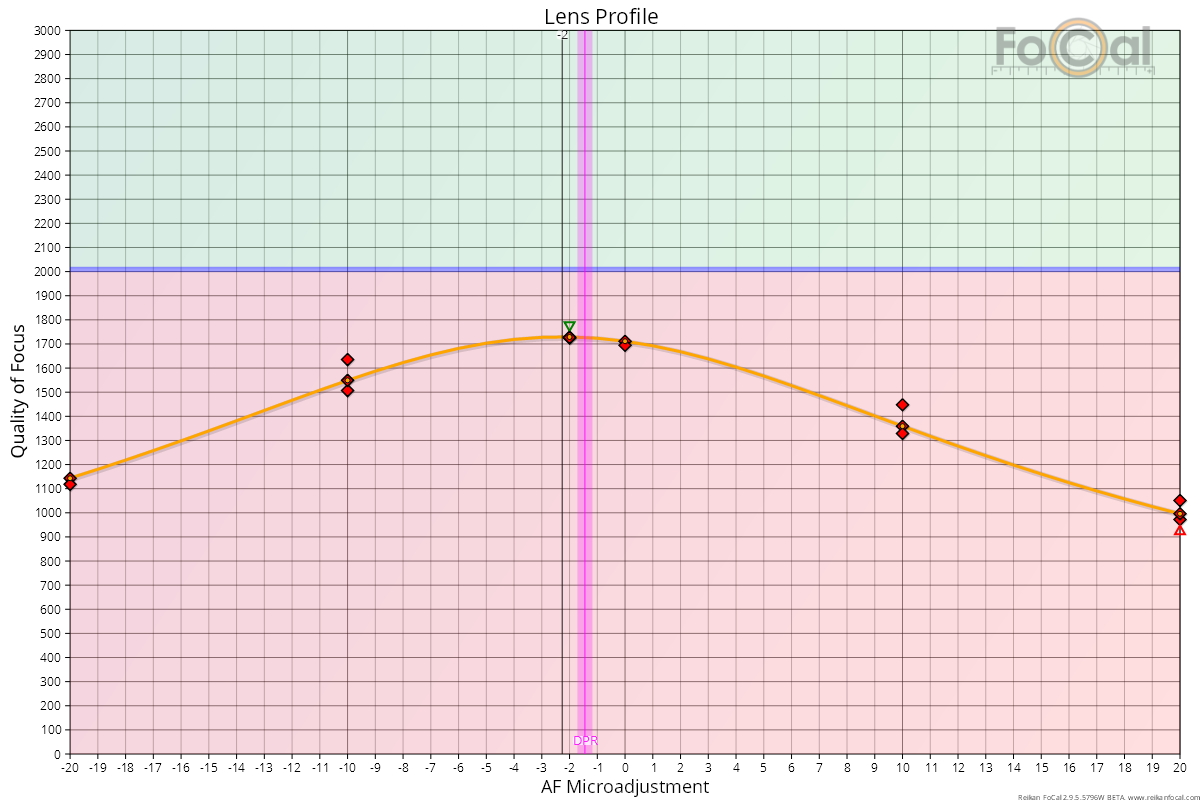
The magenta vertical band shows the Dual Pixel Raw result. The width of the band shows its confidence. It is calculated differently, so it may differ slightly from the main result. Expect the two to be within about 1 Focus Adjustment unit.
Dual Pixel Raw is an experimental measurement. Use the main FoCal result as your calibration value.