Astigmatism Factor – AF Consistency
On this page
(See Chart Features for general chart features - changing scales, copying to clipboard etc)
What this shows
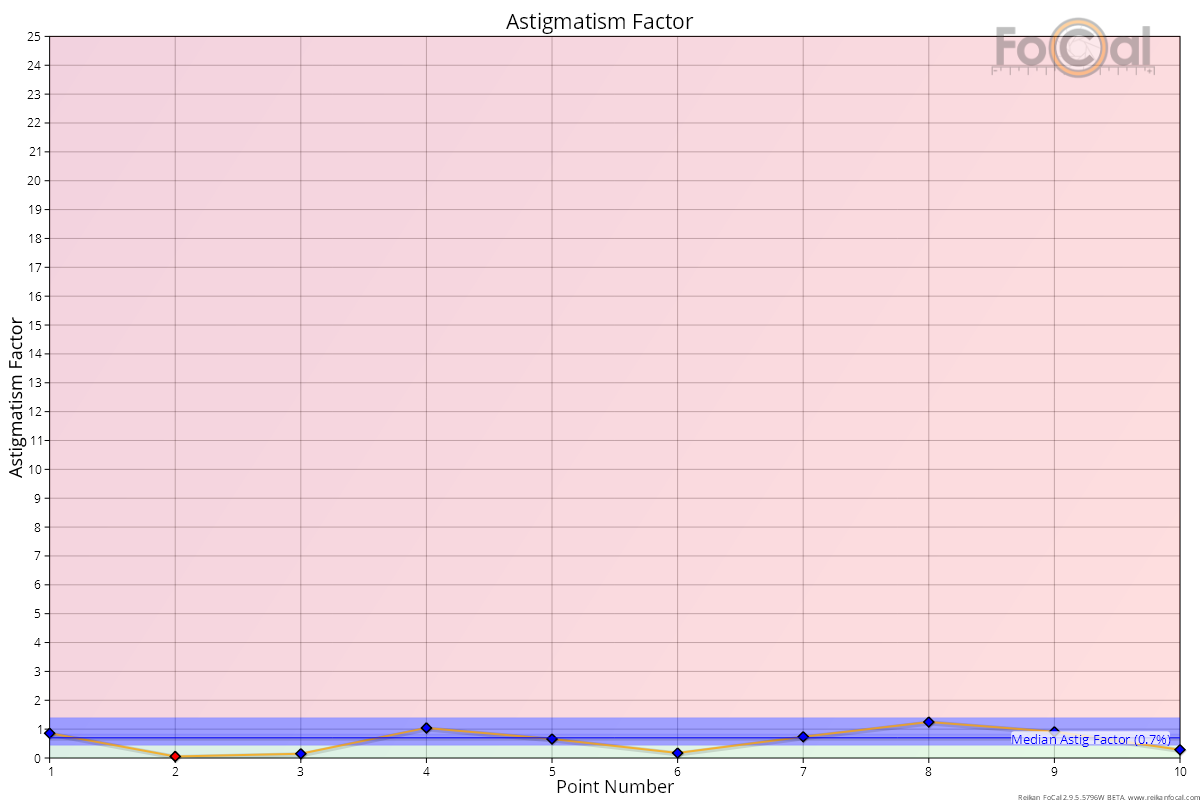
The Astigmatism Factor chart compares the sharpness measured in the horizontal and vertical directions for each shot. A well aligned lens is about equally sharp in both directions.
How to read it
- X axis: the point number through the test.
- Y axis: Astigmatism Factor, from -25% to +25%.
- 0%: horizontal and vertical sharpness are the same.
- Above 0%: the horizontal direction is sharper.
- Below 0%: the vertical direction is sharper.
- Diamonds and line: the Astigmatism Factor of each measurement. Each data set (autofocus type and defocus) has its own colour, named in the legend.
- Blue line: the median Astigmatism Factor, ignoring whether it is above or below 0%.
Where FoCal Comparison Data is available for your camera and lens, coloured bands show how your result compares with other users. The bands are symmetrical around 0%, because a difference in either direction counts the same:
- Green (nearest 0%): better than typical.
- Blue: typical (the middle half of results).
- Red (furthest from 0%): worse than typical.
What good looks like
The points sit close to 0% and close to each other. As a guide, the median should be within about 5% of zero, and the points should vary by less than about 10% through the test. Points in the green or blue band are normal for this camera and lens.
If it looks wrong
- A few points much further from 0% than the rest: this usually means vibration or movement during those shots. Vibration tends to blur one direction more than the other. Check the tripod, the floor and anything nearby that could shake the camera, then run the test again.
- All points well away from 0% (median above about 5%), test after test: the lens may have a decentred or misaligned element. Check that the result repeats, then check sharpness on real-world subjects and in the Aperture Sharpness. Repeated high values are worth raising with the lens manufacturer's service centre.
Further details
FoCal Comparison Data
The example above comes from an earlier version of FoCal, which showed only the size of the Astigmatism Factor (0% to 25%), not its direction. The points sit in the green and blue bands with a median of 0.7%, so this lens is typical or better than typical for this camera.