Red-Blue Ratio - Fully Auto Calibration
(See Chart Features for general chart features - changing scales, copying to clipboard etc)
What this shows
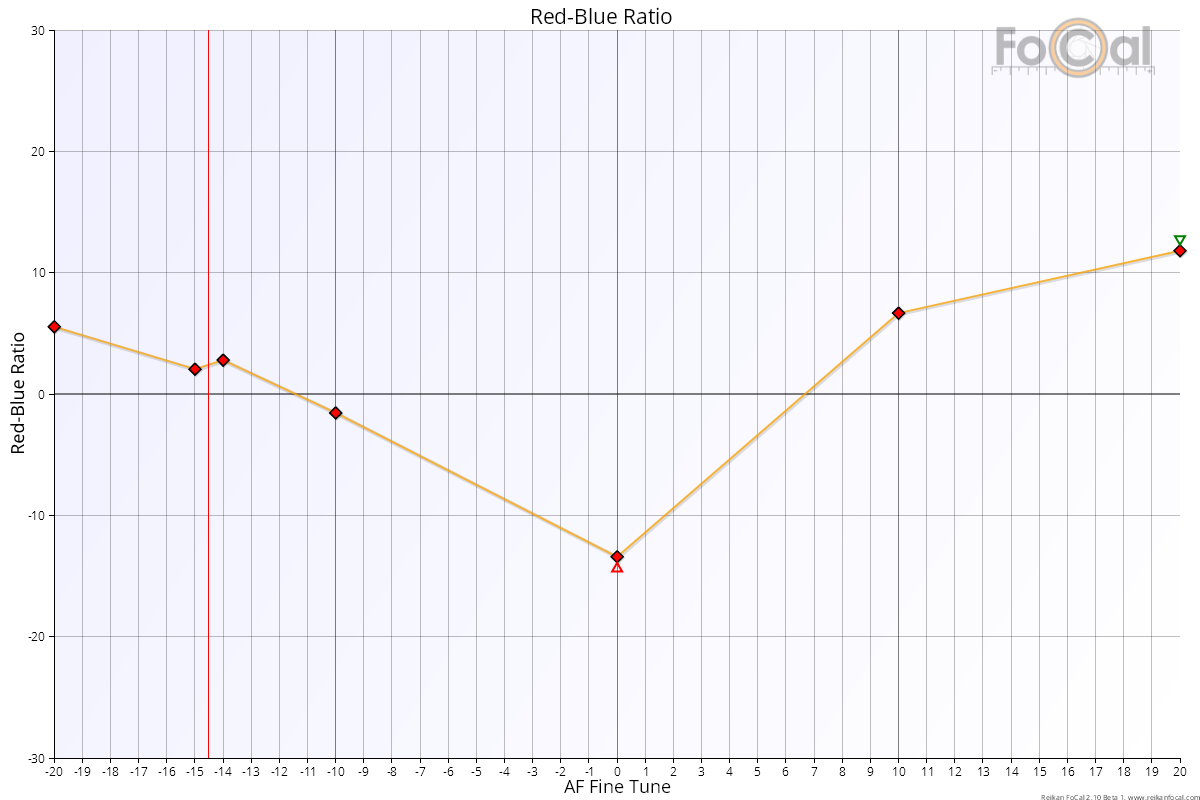
The Red-Blue Ratio compares the sharpness of the red and blue colour channels at each Focus Adjustment value. A large difference is a sign of chromatic aberration (colour fringing).
How to read it
- Horizontal axis: the Focus Adjustment value, usually -20 to +20.
- Vertical axis: Red-Blue Ratio, from -30% to +30%. 0% means red and blue are equally sharp. Above 0%, red is sharper. Below 0%, blue is sharper.
Key:
- Orange line with markers: the Red-Blue Ratio for each shot.
- Red vertical line: the calibration result.
This chart doesn't show absolute sharpness, only the difference between red and blue.
What good looks like
- Points close to 0%, especially near the calibration result.
- As a guide, FoCal scores a median difference (ignoring which channel is sharper) below about 2.4% as excellent, below about 4.3% as good and below about 7.6% as acceptable. With comparison data, the score compares you with other users of the same camera and lens instead.
- The ratio often changes across the range, because red and blue come into focus at slightly different Focus Adjustment values.
If it looks wrong
- Check that the target is lit with roughly white light. Strongly coloured lighting can skew the result (see Spectral Info on the Details – Calibration page).
- A large ratio that repeats points to chromatic aberration in the lens. Lenses with special dispersion-correcting elements usually do better.
Further Details
No lens focuses every colour at exactly the same point on the sensor. Lenses with dispersion-correcting elements (aspherical, fluorite and so on) get closer. The further apart red and blue focus, the larger the Red-Blue Ratio.