Percentage Area Affected – Dust Analysis
What this shows
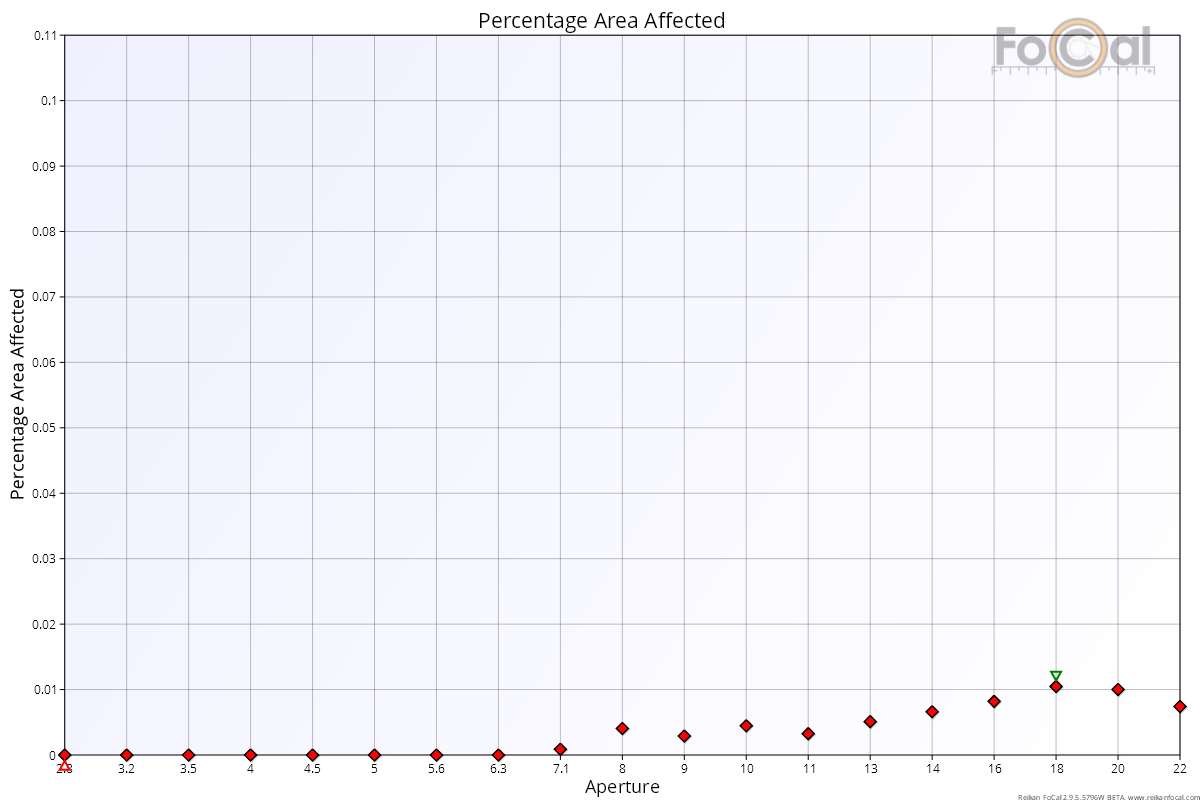
The Percentage Area Affected chart shows how much of the sensor is covered by high-confidence dust spots at each aperture.
How to read it
- Horizontal axis: aperture, wide apertures on the left.
- Vertical axis: percentage of the image area affected by dust.
Key:
- Markers: the area affected at each aperture.
- Green triangle: the highest value. Red triangle: the lowest value.
What good looks like
- A very low value. It is usually below 0.05% of the sensor, even at its highest.
- The highest value is usually a little before the smallest aperture. There, spots are dark enough to be clear but not yet at their sharpest, so they cover a larger area. At the smallest aperture they are sharpest and smallest.
If it looks wrong
A much higher value than usual means more dust, or larger spots. Check the Dust Spot Aperture Range and Dust Spot Opacity charts to see which spots matter, and consider cleaning the sensor.
The Dust Coverage Area result on the Details tab is the value at the smallest aperture tested.