Dust Spot Opacity – Dust Analysis
What this shows
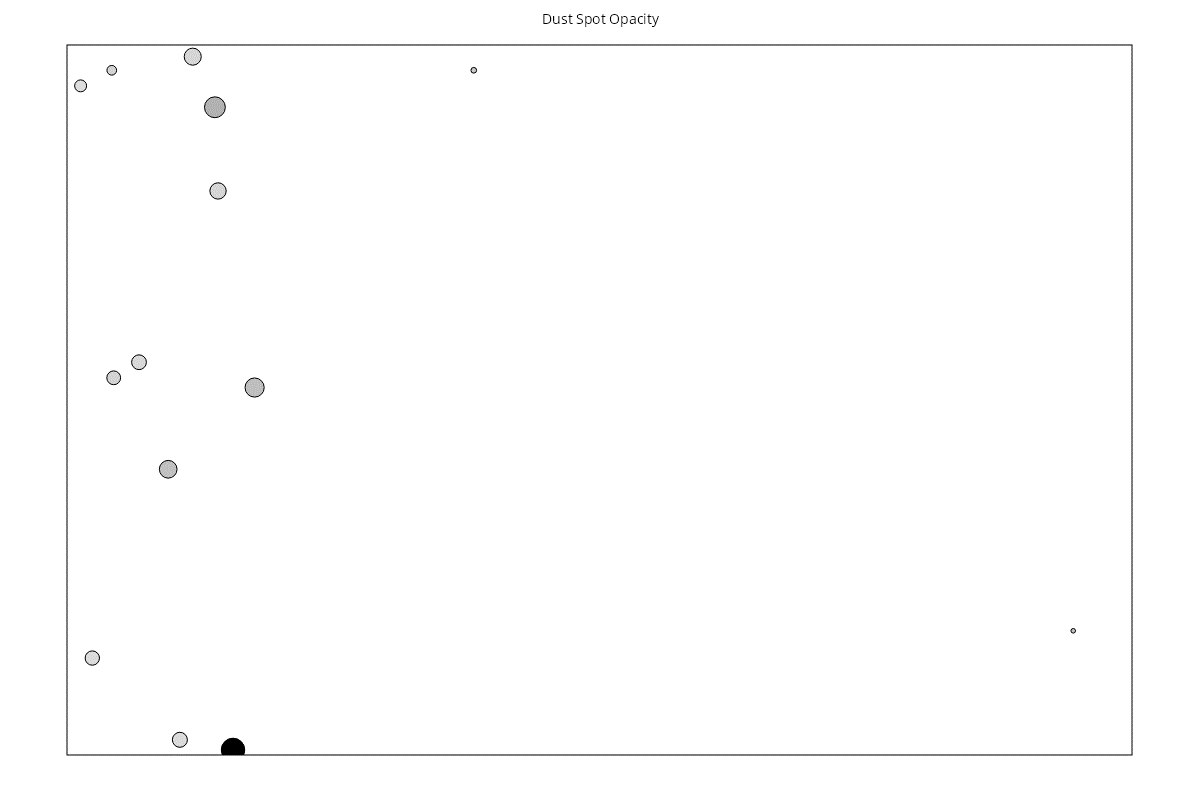
The Dust Spot Opacity chart is a map of your sensor showing the dust spots, shaded by how dark (opaque) each one is.
How to read it
The rectangle represents the image area. The position of each circle is where the spot appears in your pictures.
- Darkness: the closer to black, the more opaque the spot. FoCal uses the darkest the spot appeared at any aperture in the test.
- Size is proportional to the size of the spot, but drawn much larger than real life so you can see it.
Potential hot pixels aren't shown here (see Potential Hot Pixels – Dust Analysis). Marks that appear at only one aperture are ignored.
Click a spot to select it. FoCal outlines it in red, shows the aperture range it appears at, and shows a crop of the image. Crops are only available if Save Captured Image Files was on when the test ran (see Settings – Dust Analysis).
What good looks like
Few spots, and those that are there very faint. Faint spots are hard to see in real pictures, even at small apertures.
If it looks wrong
Dark spots are the most likely to show in your pictures, especially in plain areas like sky. Click a dark spot to check the crop. If it is real dust, clean the sensor and run the test again.