Red Quality – MultiTest
(See Chart Features for general chart features - changing scales, copying to clipboard etc)
What this shows
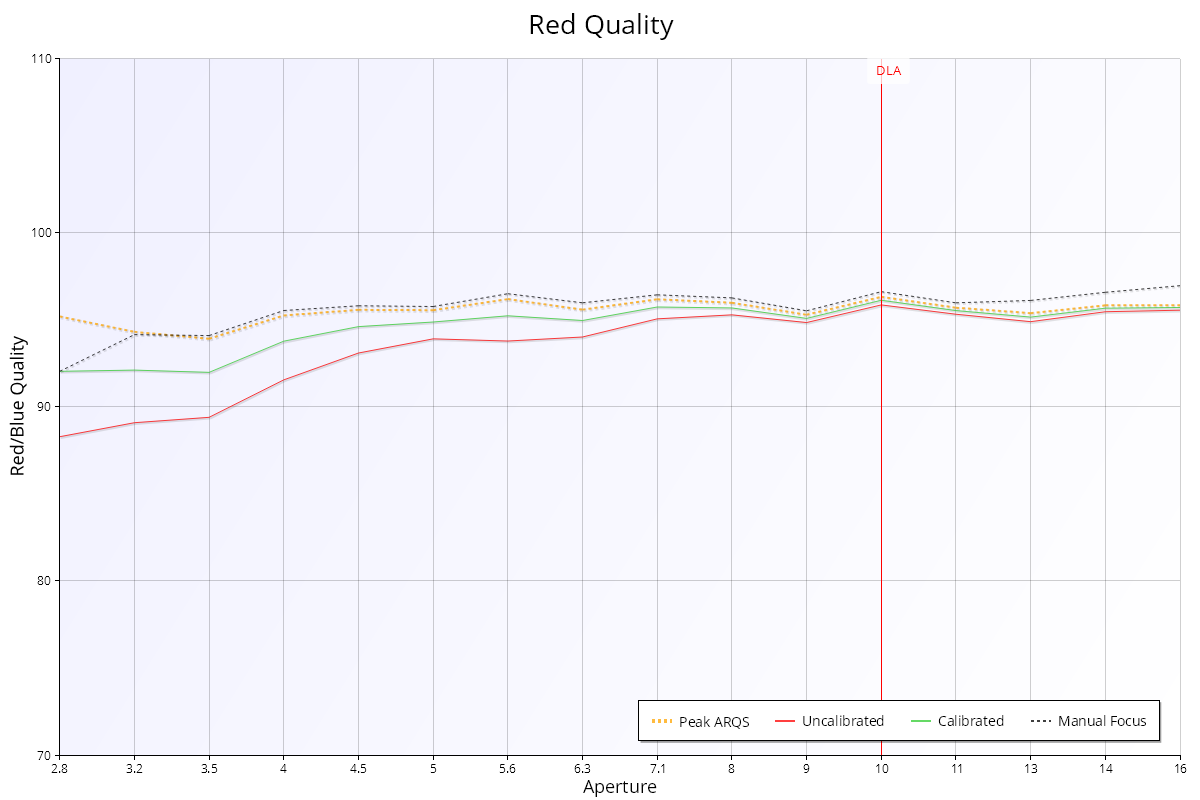
The Red Quality chart shows the sharpness of the red channel compared with the green channel, at each aperture.
How to read it
- X axis: aperture, from wide open on the left.
- Y axis: red quality as a percentage of green quality, from 70% to 110%. 100% means red is as sharp as green.
- Red line ("Uncalibrated"): Red quality with the focus adjustment at 0. In Live View mode this line is called "Wide Open" (focused wide open, then stopped down).
- Green line ("Calibrated"): Red quality with the lens calibrated for best focus wide open.
- Orange dashed line ("Peak ARQS"): Red quality at the focus adjustment with the best average quality across all apertures (see Aperture Range Quality Score (ARQS) – MultiTest).
- Black dashed line ("Manual Focus"): Red quality when focused perfectly at each aperture.
- "DLA" marker: the diffraction limited aperture for this camera.
The Calibrated and Peak ARQS lines are only shown when the test uses camera focus adjustment.
What good looks like
The lines are steady and close to 100%. Values a little below 100% are normal, because most lenses and autofocus systems are optimised for green. Values above 100% mean red is sharper than green. The chart doesn't show how sharp the image is overall.
If it looks wrong
- Well below 100%: red is noticeably less sharp than green, which shows as colour fringing on high-contrast edges. This is a property of the lens design, not something calibration fixes. See Red-Blue Ratio – MultiTest for an introduction to chromatic aberration.
- Unexpected values with JPEG: the camera's processing mixes the colour channels, so test in Raw mode for accurate colour results.