Autofocus System Performance – Calibration Check
(See Chart Features for general chart features - changing scales, copying to clipboard etc)
What this shows
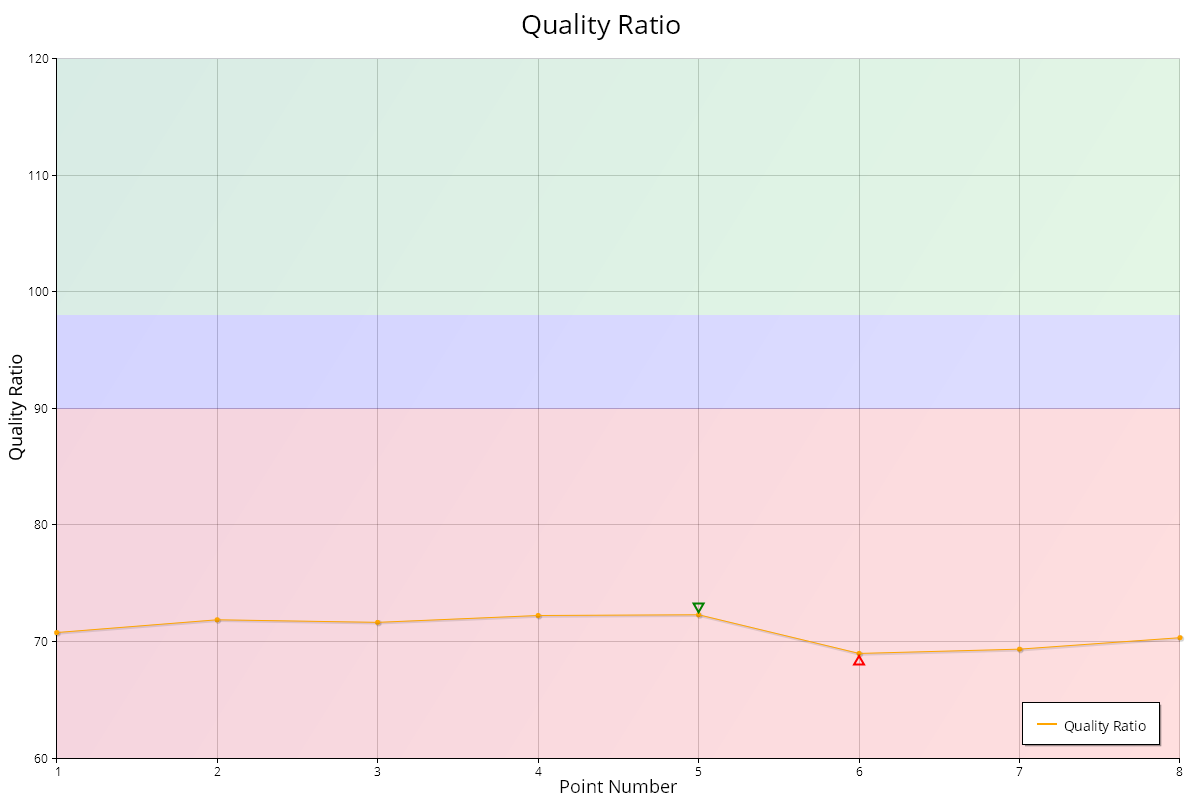
The Autofocus System Performance chart shows, for each measurement, how sharp the camera's normal autofocus shot is compared with a carefully focused reference shot. It is the main result of Calibration Check.
How to read it
- Horizontal axis: measurement (point) number, in the order the test took them.
- Vertical axis: Focus Performance, as a percentage. 100% means the autofocus shot is as sharp as the reference. The scale runs from 50% to 100%, or to 120% when the reference is a Live View autofocus shot.
The reference is either a shot focused by FoCal's own peak search, or a Live View (contrast detect) autofocus shot, depending on the camera and settings. The Mode result on the Details tab says which was used.
Key:
- Orange diamonds and line: the Focus Performance for each measurement.
- Black dashed line: the median Focus Performance, the overall result.
- Background colours (the same thresholds as the result on the Summary tab):
- Green, at 100% and above: the autofocus is as good as the reference.
- Shading from orange to green, 90% to 100%: well calibrated.
- Shading from red to orange, 59% to 90%: acceptable, but calibrating is likely to improve your pictures.
- Red, below 59%: the lens should be calibrated.
What good looks like
- Most points, and the black median line, at 90% or above.
- Points close together. Widely scattered points mean the autofocus isn't consistent, and lower the Result Confidence.
- Over 100% means the autofocus beat the reference shot. That's good news, but FoCal can't then say exactly how good.
If it looks wrong
- Median below 90%: run a full Fully Auto calibration if your camera has a focus adjustment setting.
- Widely scattered points: check the tripod is steady, the light is good and the target is set up correctly (run Target Setup), then run the test again.
Further Details
The Result Progression chart (on the Summary tab) shows how the overall result built up during the test. Each point is the median Focus Performance using only the measurements up to that point, with a green band showing the confidence in the result so far. The result settles as the test goes on.