Image Motion - Fully Auto Calibration
(See Chart Features for general chart features - changing scales, copying to clipboard etc)
What this shows
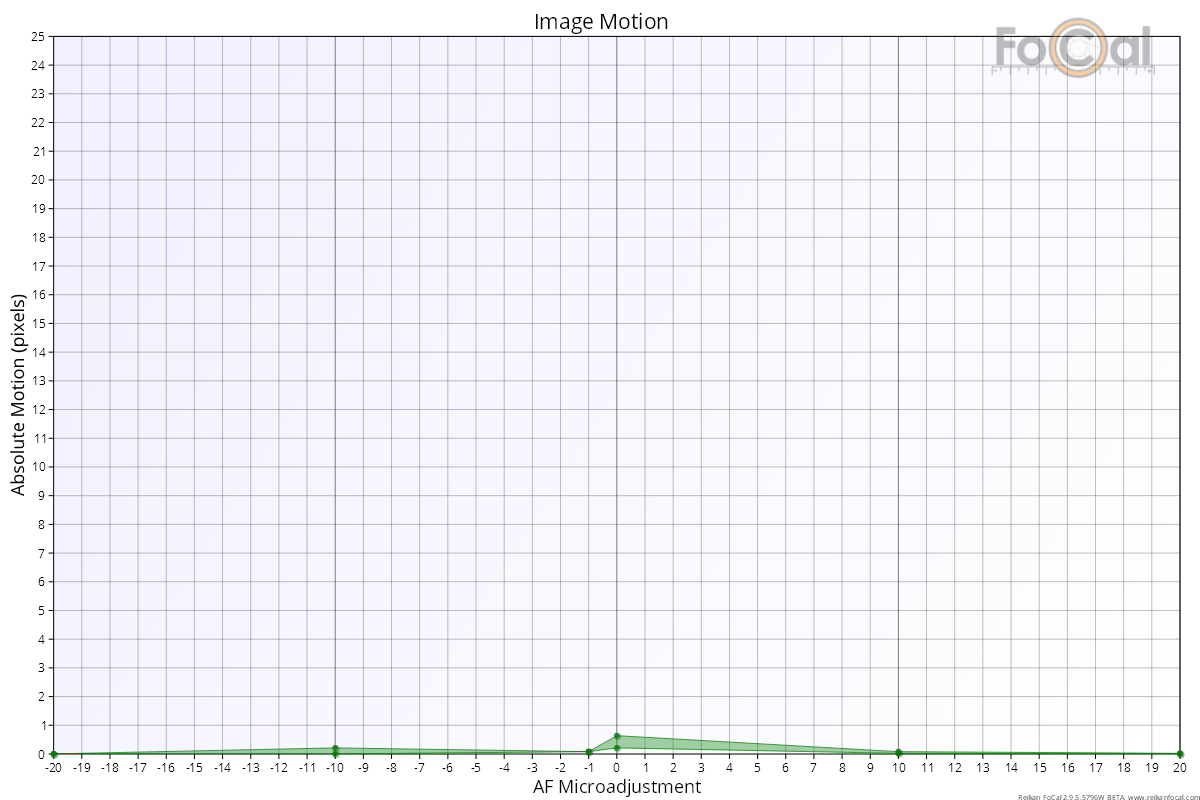
The Image Motion chart shows how far the image of the FoCal target moves on the sensor during the test. In a Fully Auto calibration, the lens refocuses for every shot, so this chart can reveal loose or misaligned optics, or a camera that moved.
How to read it
- Horizontal axis: the Focus Adjustment value, usually -20 to +20.
- Vertical axis: absolute motion, in pixels (0 to 25). This is a distance only, with no direction.
Key:
- Green circles: the image motion for each shot, measured from the target's average position during the test.
- Green vertical bars: the range of motion for all the shots at each Focus Adjustment value.
- Red vertical line: the calibration result.
What good looks like
- Movement well under a pixel or two across the whole range. The example above is a good result, with movement of less than a single pixel.
- As a guide, FoCal scores a median below about 0.7 pixels as excellent, below about 1.3 pixels as good and below about 2.7 pixels as acceptable. With comparison data, the score compares you with other users of the same camera and lens instead.
If it looks wrong
- A few high points: the camera or tripod probably moved, or something vibrated. Check the setup is stable and run the test again.
- High values that repeat: this could mean misaligned lens optics. Run the test again on a different day, or on a different camera body, before drawing conclusions.
Further Details
The example below is from an old, low-cost lens design (the Canon EF 28-90mm). The image moves clearly across the test. This is probably slightly misaligned optics and a front element that rotates as it focuses, which is common on cheaper lenses:
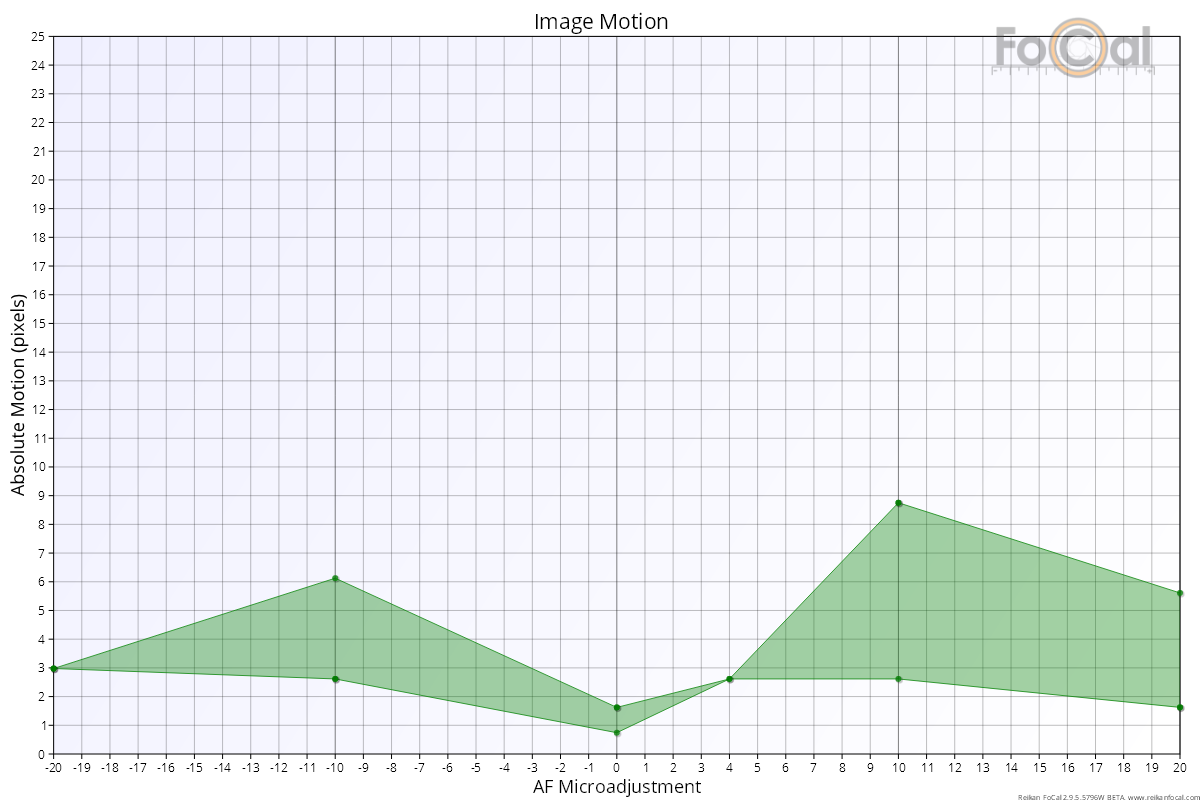
The Image Motion (2D) chart (in the chart list on the Details tab) shows the same movement as a path across the sensor, so you can see which direction the image moved in.