Chart Features
This page describes features that work on most charts in FoCal tests.
Changing the chart scale
Most charts start with a fixed scale, so you can compare results between lenses and cameras easily:
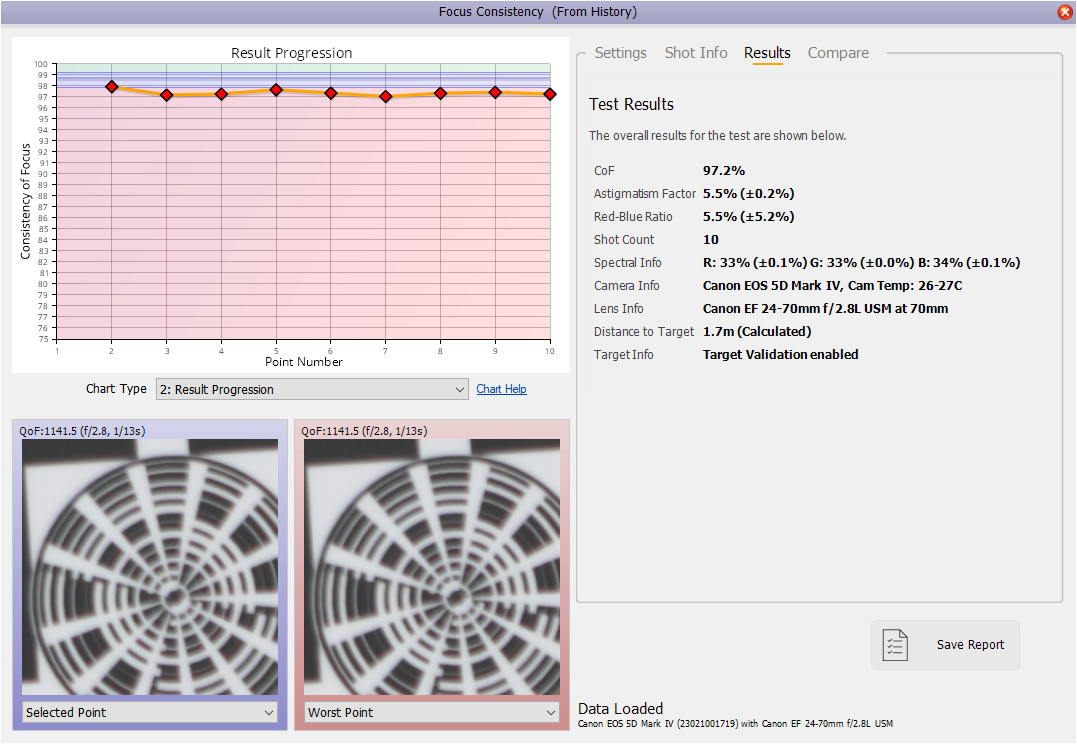
This gives a good overview (above, for example, the Focus Consistency results are all between 93% and 100%), but it can hide the detail.
To fit the scale to the data, click the numbers on the Y axis:
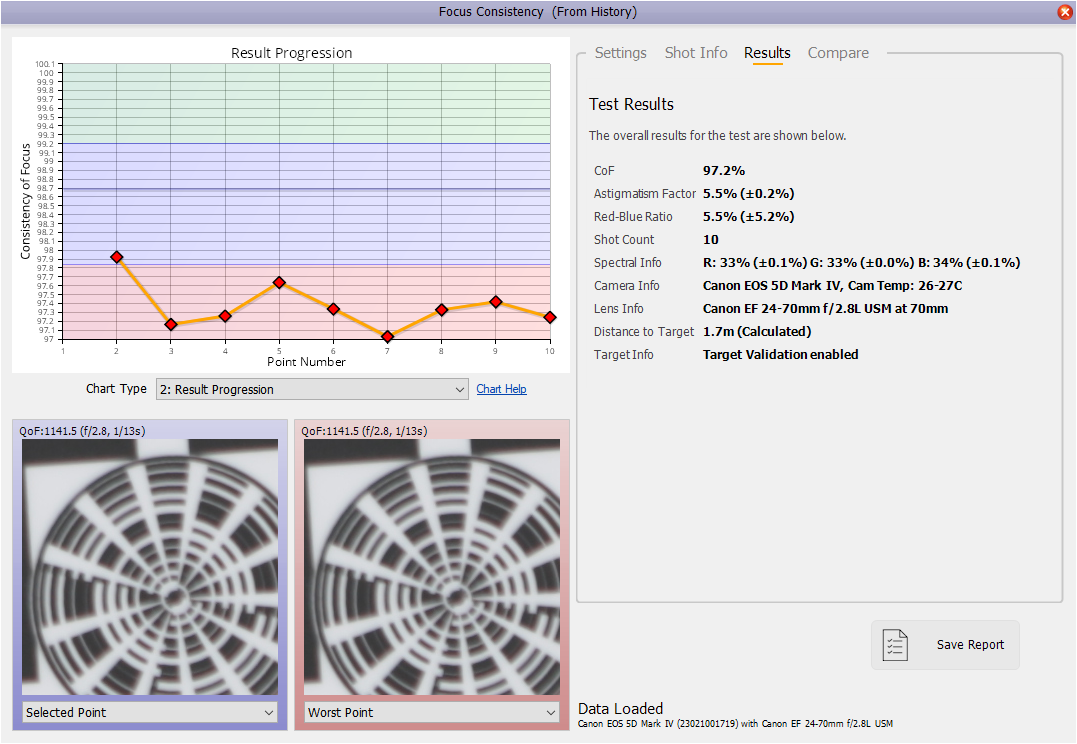
Click the Y axis numbers again to go back to the original scale.
Moving between points
On the Details tab, press Z and X on the keyboard to move to the previous or next point on the chart. The Shot Detail card and the crops update to show the selected point.
Ignoring points
In some tests you can leave a point out of the results:
- Right-click the point's marker (on a Mac trackpad, click with two fingers).
- The marker turns white, and the point is left out of the overall results.
To include the point again, right-click it again.
If several points overlap, right-clicking repeatedly changes which of them is ignored.
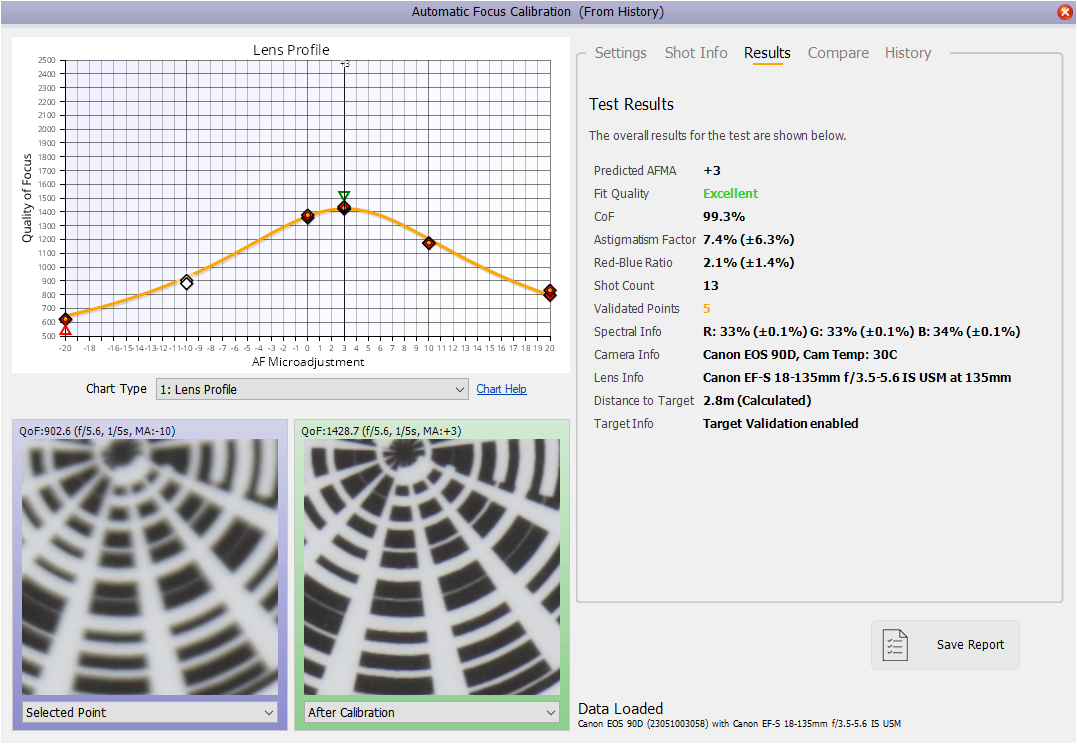
The image below shows a Focus Calibration reopened from History with a few points ignored (the white points at AF Fine-Tune -10 and -1):
Copying a chart
Click the copy button next to the chart's title to copy the chart to the clipboard. You can then paste it into a document or a web page.