Red-Blue Ratio – AF Consistency
(See Chart Features for general chart features - changing scales, copying to clipboard etc)
What this shows
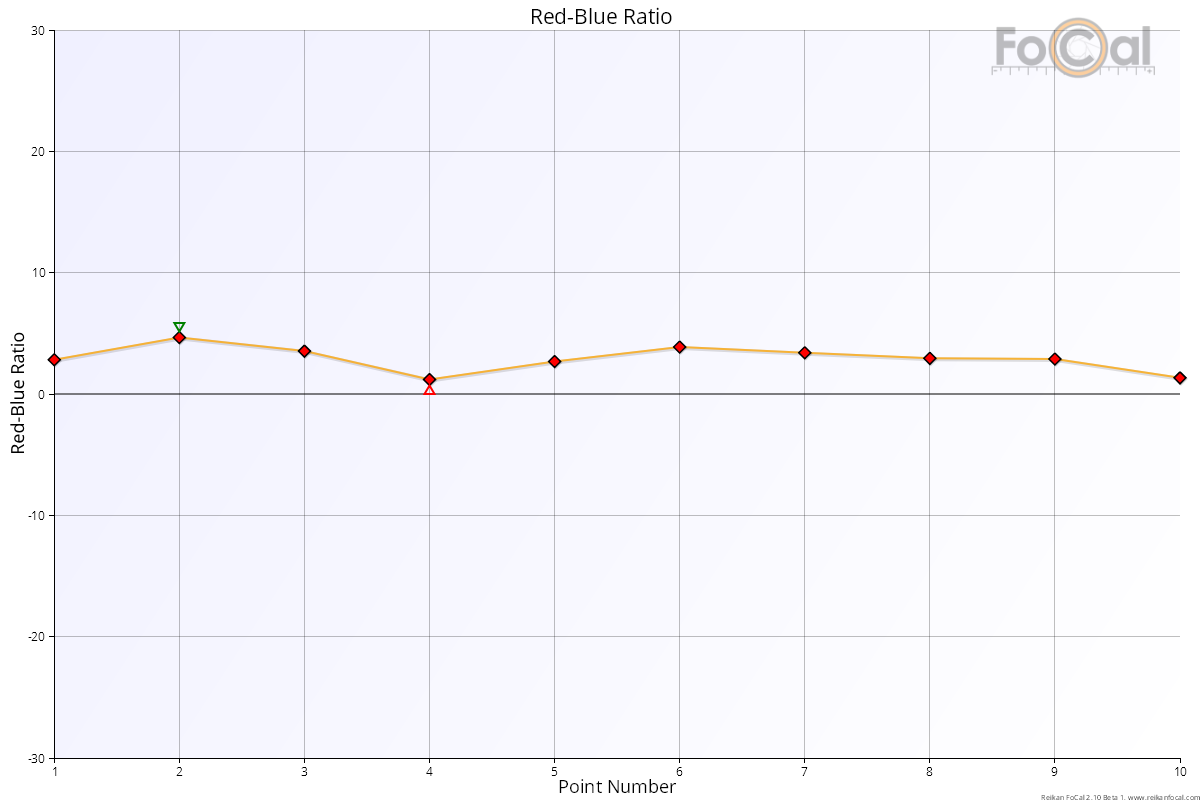
The Red-Blue Ratio chart compares the sharpness of the red and blue colour channels for each shot. It shows whether the lens focuses red and blue light to the same point.
How to read it
- X axis: the point number through the test.
- Y axis: Red-Blue Ratio, from -30% to +30%.
- 0%: red and blue are equally sharp.
- Above 0%: the red channel is sharper.
- Below 0%: the blue channel is sharper.
- Diamonds and line: the Red-Blue Ratio of each measurement. Each data set (autofocus type and defocus) has its own colour, named in the legend.
- Triangles: the highest and lowest values in each data set.
The chart shows the difference between red and blue only. It doesn't show how sharp the image is overall.
What good looks like
The points sit close to 0% and close to each other. No lens focuses every colour to exactly the same point, so a small, steady offset is normal. Lenses with special low-dispersion elements (for example aspherical or fluorite) usually show a smaller difference.
If it looks wrong
- Large values (well away from 0%): the lens shows strong chromatic aberration at this focus distance. You may see colour fringing on high-contrast edges. This is a property of the lens design, not something calibration fixes.
- Values jumping around from shot to shot: focus is landing in different places. Check the Quality of Focus – AF Consistency chart and the setup.
- Unexpected values with JPEG: the camera's processing mixes the colour channels, so the red and blue figures are only approximate. Test in Raw mode for accurate colour results.