Focus & Aperture Quality – MultiTest
(See Chart Features for general chart features - changing scales, copying to clipboard etc)
What this shows
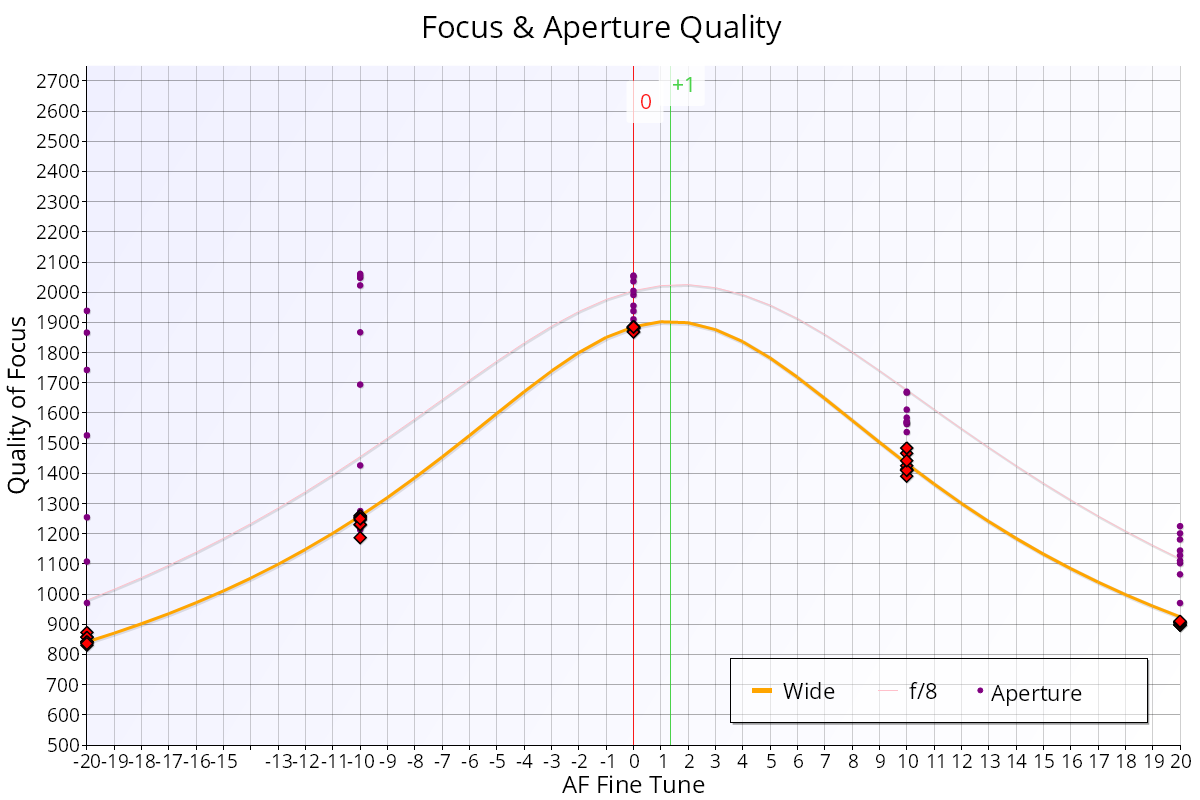
The Focus & Aperture Quality chart shows how sharpness changes across the focus adjustment range, wide open and stopped down. It is the MultiTest version of the calibration curve. Until there is enough data for the Quality Grid – MultiTest, it is the chart on the Summary tab.
How to read it
- X axis: focus position (AF Microadjustment / AF Fine Tune units, or focus offset units in Live View mode, see MultiTest (Live View)).
- Y axis: Quality of Focus. Higher is sharper.
- Diamonds: autofocus shots taken wide open, as in the Calibration test (red, or green where Target Optimisation adjusted the analysis position).
- Small purple circles ("Aperture"): shots at each focus position as the aperture is stopped down, from wide open to the narrowest tested aperture (f/16 by default).
- Orange line ("Wide"): the modelled sharpness across the focus range, wide open.
- Pink line ("f/8"): the modelled sharpness when focused wide open and then stopped down to f/8.
- Green vertical line: the best focus adjustment wide open, the highest point of the orange line.
- Red vertical line: the focus adjustment with the best average across all apertures (peak ARQS, see Aperture Range Quality Score (ARQS) – MultiTest). Only shown when the test uses camera focus adjustment.
- Blue horizontal band: the range of quality from the other autofocus system, if you turned on Measure Live View Focus or Measure Phase Detect Focus. The thicker part shows the typical range.
What good looks like
- The diamonds sit on or close to the orange line, and the green line is at its peak.
- The purple circles rise as the lens stops down, because most lenses get sharper. The topmost circles show the best quality at any aperture.
- The pink f/8 curve is flatter than the orange one, with higher values at the far left and right.
If it looks wrong
- The peak of the purple circles is to one side of the green line: the sharpest stopped-down images come from shifting the focus a little from the wide-open autofocus result. In the example above, the left-hand peaks are higher than the right, so the best quality comes from focusing slightly towards the camera (a negative focus adjustment). This is focus shift. The Quality Grid – MultiTest and Aperture Sharpness Profile – MultiTest show it more clearly.
- The pink curve peaks away from the orange one: this also shows focus shift.
- Diamonds scattered well away from the orange line: some shots were unreliable. Check the setup and the light.