Comparison Data Difference – Aperture Sharpness
(See Chart Features for general chart features - changing scales, copying to clipboard etc)
What this shows
The Comparison Data Difference chart shows, aperture by aperture, how your lens's sharpness profile differs from other users' results for the same camera and lens. It only has data when FoCal Comparison Data is available for your kit.
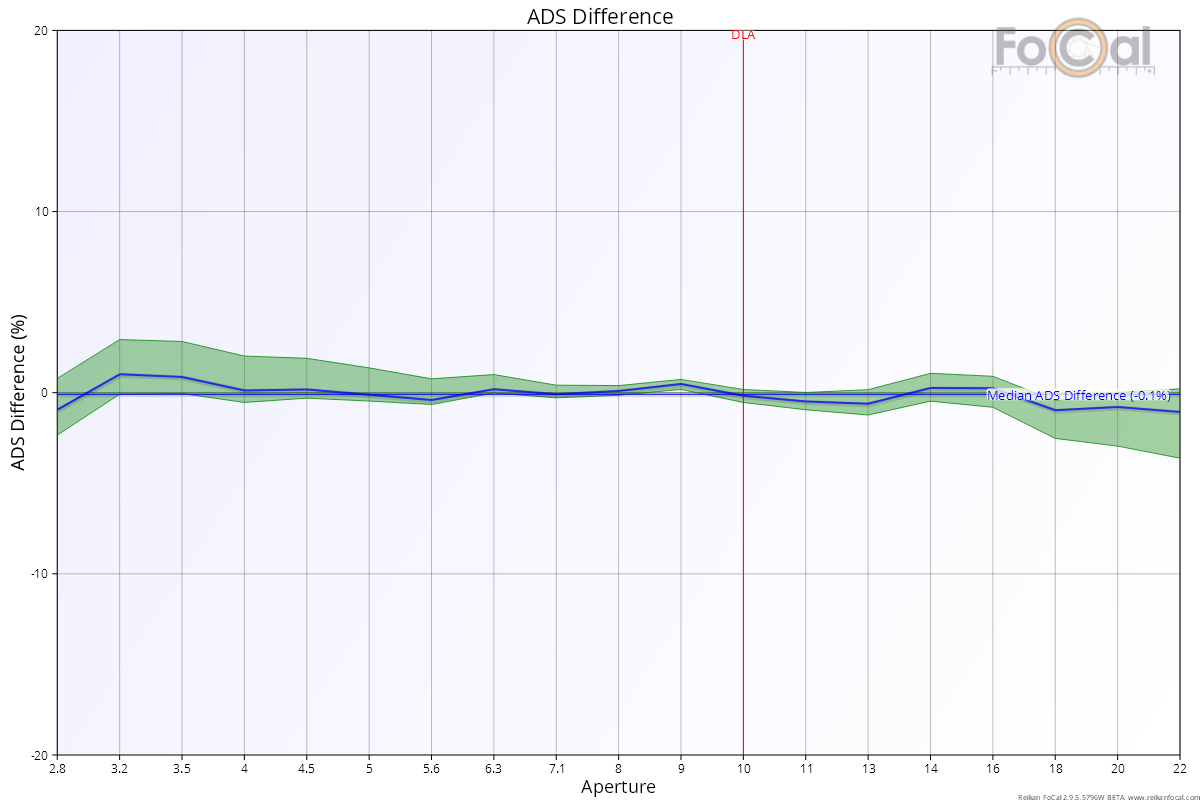
How to read it
- Horizontal axis: aperture, wide open on the left.
- Vertical axis: difference in sharpness, from -20% to +20%. 0% means the same as other users.
Both your results and the comparison data are scaled to the sharpness at a reference aperture before they are compared. So this chart compares the shape of the profile (how sharpness changes as you stop down), not absolute sharpness.
Key:
- Orange line: the difference between your result and the median (middle) result of other users. If you choose a single colour channel in the Channel box, the line takes that channel's colour.
- Green range: the difference between your result and the typical range of other users' results (the middle half, between the first and third quartiles).
- Blue horizontal line: the median difference across all the apertures tested, labelled with its value.
- Red vertical line labelled DLA: the diffraction limited aperture for your camera.
What good looks like
- The orange line stays close to 0% and the green range straddles the 0% line at most apertures. Your lens behaves like a typical copy.
- Where the whole green range is above 0%, your lens is better than three-quarters of other users' results at that aperture. Where it is entirely below 0%, it is worse than three-quarters of them.
- A median line close to 0%.
If it looks wrong
- A few points below 0%: this can be normal test-to-test variation. Repeat the test to see if it happens again.
- A large drop at some apertures, or a median well away from 0%, that repeats: your lens is not behaving like a typical copy. Look at the Lens Profile and Astigmatism Factor charts as well. Together they show whether the lens needs further investigation.
- No data: check that FoCal Comparison Data is available for your camera and lens, and that the test captured the reference aperture.
Further Details
The first example above shows a lens that performs very like a typical copy. Below is a lens with a problem as it opens towards f/2.8:
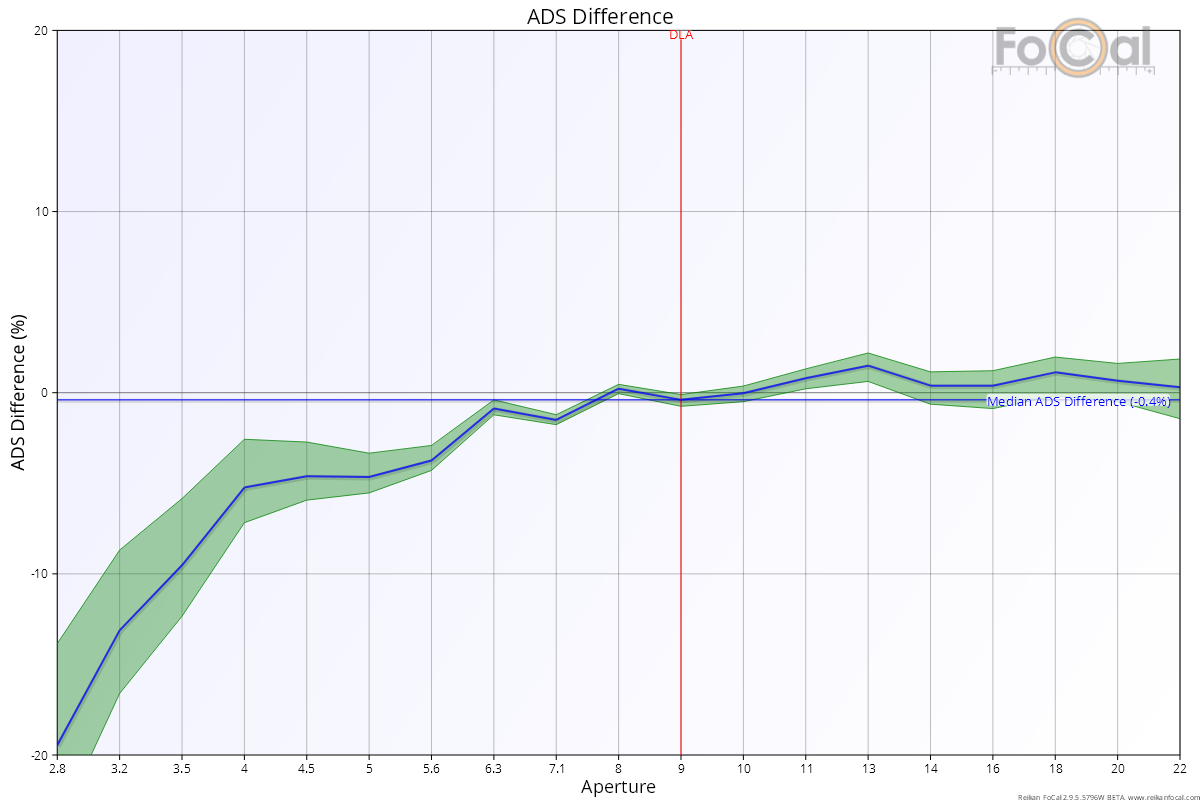
The line drops sharply at the widest apertures. The measured sharpness there is much lower than usual for this lens. With the Lens Profile and Astigmatism Factor charts, this shows a significantly under-performing lens that needs further investigation.