Dual Pixel Raw Focus Offset – AF Consistency
On this page
(See Chart Features for general chart features - changing scales, copying to clipboard etc)
What this shows
The Dual Pixel Raw Focus Offset chart shows how far each shot was from perfect focus, measured from the camera's dual-pixel sensor data. It appears only when the test is run in Raw mode with Dual Pixel Raw turned on in both FoCal and the camera.
How to read it
A dual-pixel sensor records two slightly different images (A and B). When the image is perfectly in focus they line up exactly. The further out of focus, the further apart they are. This chart plots that separation.
- X axis: the point number through the test.
- Y axis: image separation, in microns (µm) on the sensor, or in pixels if FoCal doesn't know the camera's pixel size. 0 means perfectly in focus.
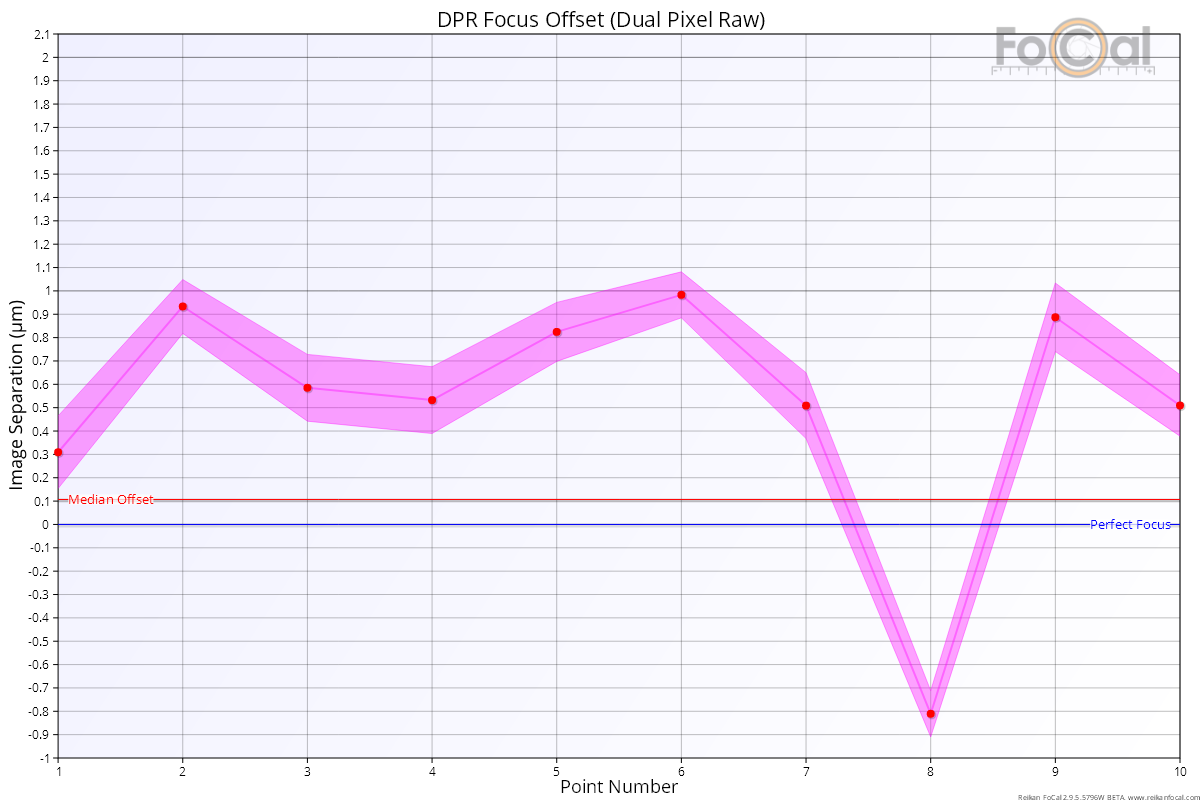
- Red circles: the measured offset from perfect focus for each shot.
- Pink bars: the confidence of each measurement. The real value lies somewhere within the bar.
- Blue line ("Perfect Focus"): zero offset.
- Red line ("Median Offset"): the median offset across the whole test.
The separation is measured at the sensor. How it translates into a focus error at the target depends on the focal length, aperture and subject distance. So you can compare values from tests with the same focal length, aperture and distance, but not across different setups.
What good looks like
The points scatter on both sides of the blue Perfect Focus line, and the red median line sits very close to it. The example above shows a well calibrated lens doing exactly this.
If it looks wrong
- The points and the median sit well to one side of the blue line: the lens is consistently focusing in front of or behind the target. Calibrate it with a Focus Calibration, then run this test again.
- The points are widely scattered: the autofocus is not repeatable. See the Quality of Focus – AF Consistency and Results Progression – AF Consistency charts, and check the setup.
Further details
This is an experimental measurement. Use the Consistency of Focus result as the main measure of the test.
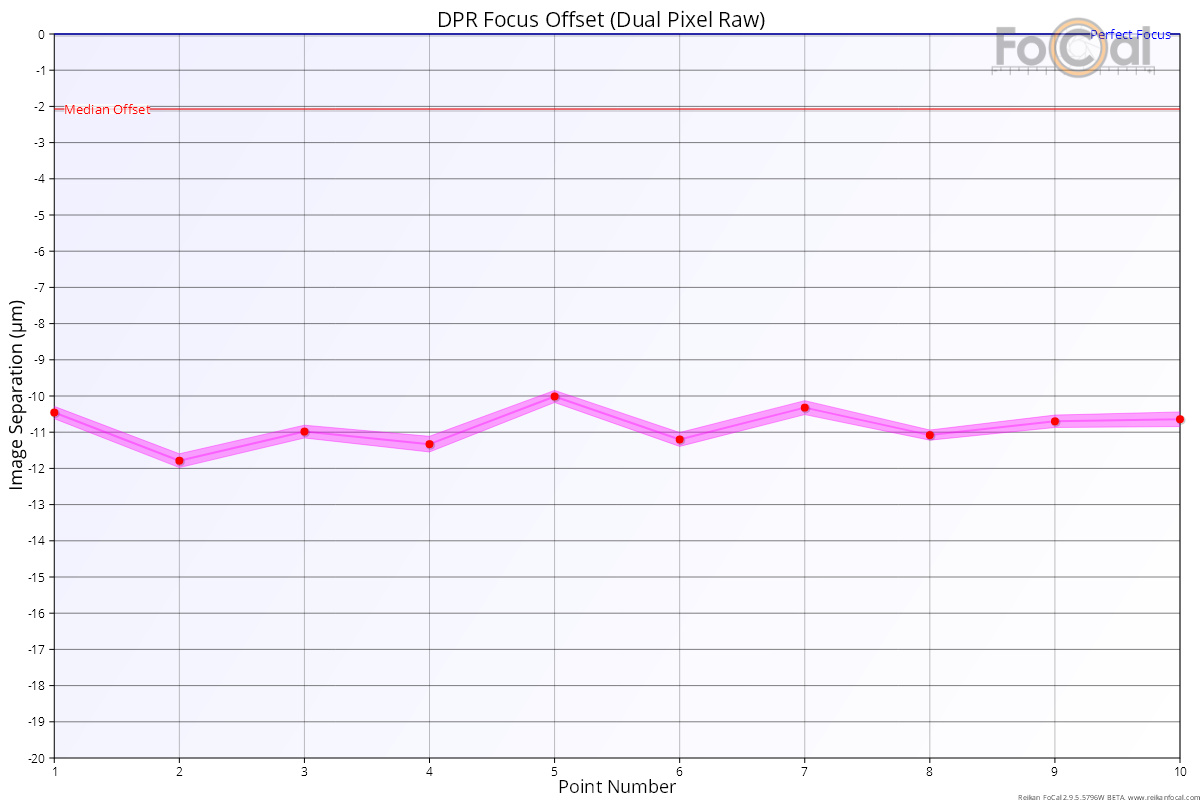
Example of a poorly calibrated lens
This is the same camera and lens as above, but badly calibrated. The offset is over 10 microns, compared with fractions of a micron above. The pink bars sit far from the blue Perfect Focus line, which is at the very top of the chart.