Astigmatism Factor - Fully Auto Calibration
(See Chart Features for general chart features - changing scales, copying to clipboard etc)
What this shows
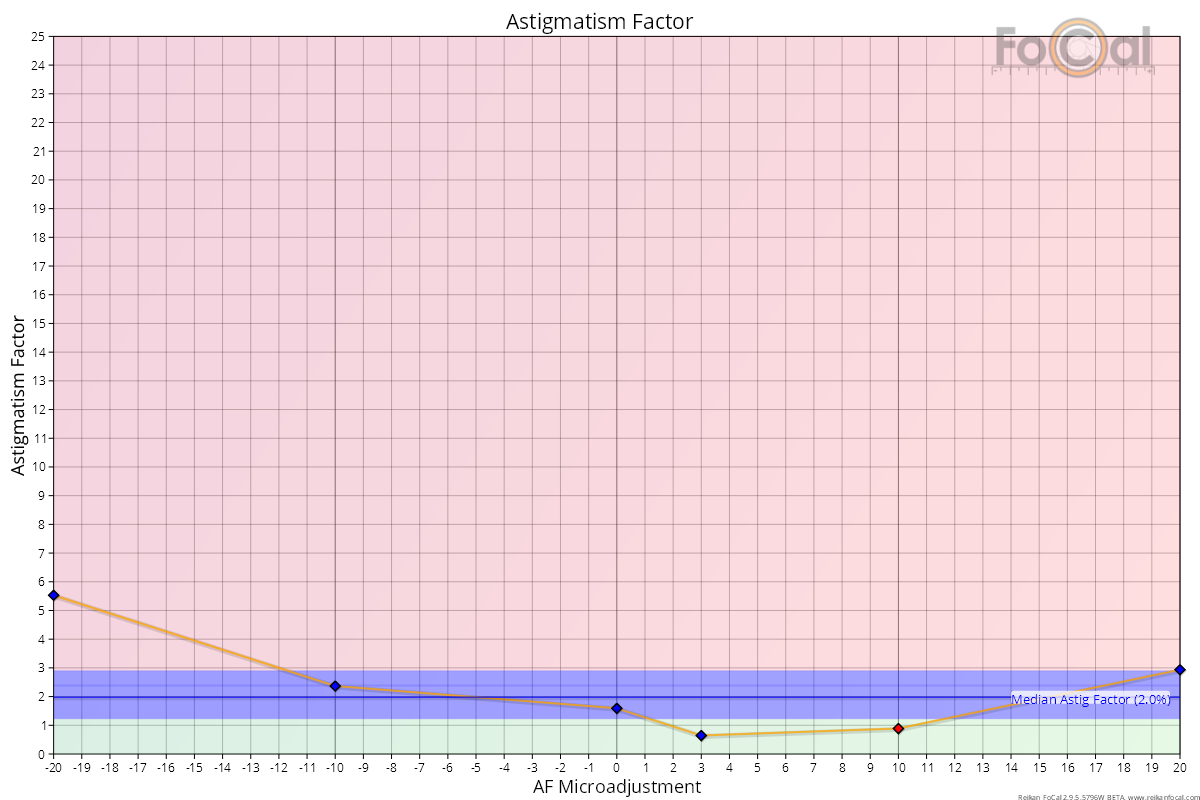
The Astigmatism Factor chart compares the sharpness measured in the horizontal and vertical directions at each Focus Adjustment value. A well-aligned lens is about equally sharp in both directions.
How to read it
- Horizontal axis: the Focus Adjustment value, usually -20 to +20.
- Vertical axis: Astigmatism Factor, from -25% to +25%. 0% means horizontal and vertical sharpness are equal. Above 0%, the horizontal direction is sharper. Below 0%, the vertical direction is sharper. The number is how much sharper, as a percentage.
Key:
- Orange line with markers: the Astigmatism Factor for each shot.
- Blue horizontal line: the median Astigmatism Factor for the test, ignoring direction (the median of the absolute values). It is labelled with its value.
- Red vertical line: the calibration result.
Where FoCal Comparison Data is available for your camera and lens, coloured bands show how your result compares with other users. The bands are symmetrical around 0%, because a difference in either direction counts the same:
- Green band (nearest 0%): better than typical.
- Blue bands: typical. The middle half of other users' results (between the first and third quartiles).
- Red areas (furthest from 0%): worse than typical.
What good looks like
- Points close to 0% across the range, and a low median line.
- As a guide, FoCal scores a median below about 1.3% as excellent, below about 2.4% as good and below about 4.8% as acceptable. With comparison data, the score compares you with other users of the same camera and lens instead.
- Some rise far from the calibration result is normal, because the image is very blurred there. A good, well-aligned lens still shouldn't change by much.
If it looks wrong
- A few points far from 0%, but not a pattern: this is often vibration during those shots. Vibration usually blurs one direction more than the other. Make the setup steadier and run the test again.
- Values that change by more than about 10% across the range, or a median above about 5%, that repeat: the lens may have decentred or misaligned elements. Check that the calibration repeats, look at the autofocus consistency, and compare with real-world photos.
Further Details
Vibration
The Astigmatism Factor can show that the camera vibrated during a test. Look for large values at some points but not all of them.
The chart below is from a test that was deliberately vibrated at the -20, -10 and +20 points. The Astigmatism Factor is much higher than average at those points:
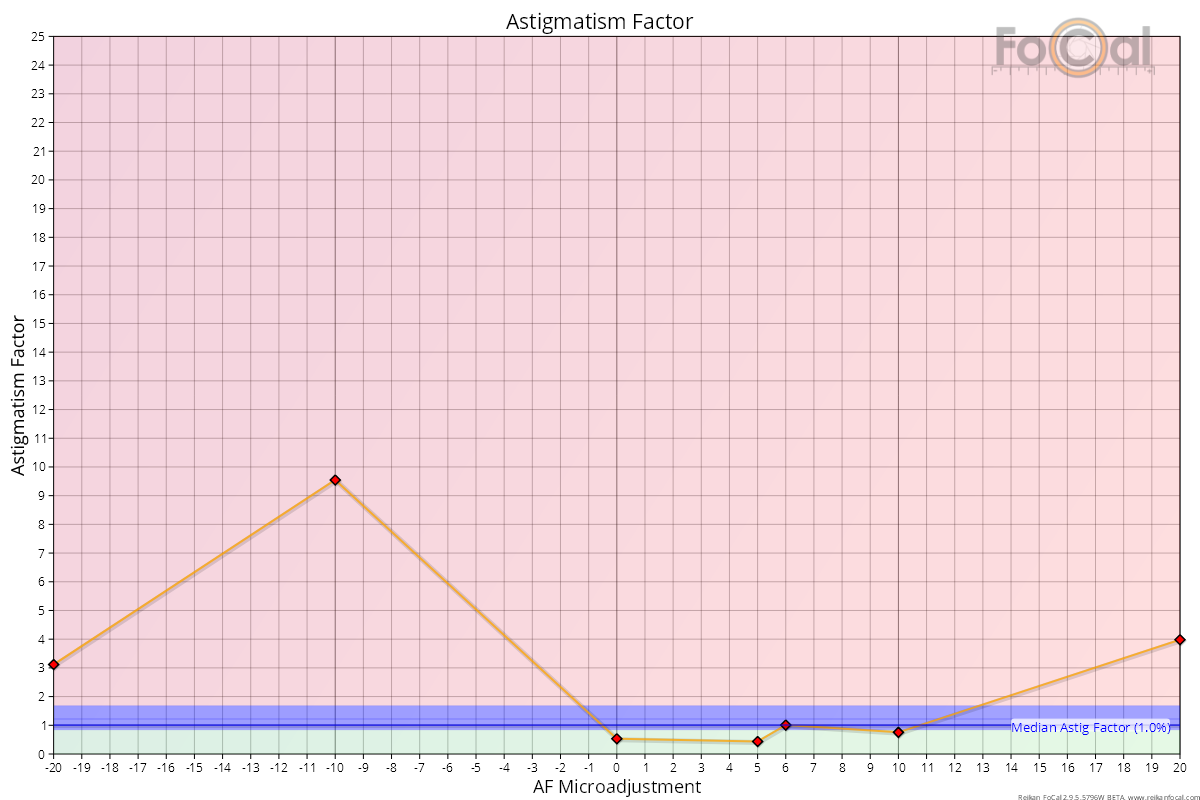
Note: these example charts are from an older version of FoCal, which plotted the value without its sign (0% to 25%).