Quality of Focus – AF Consistency
On this page
(See Chart Features for general chart features - changing scales, copying to clipboard etc)
What this shows
The Quality of Focus chart shows how sharp each shot in the test was. Each point is one measurement: FoCal defocused the lens, the camera refocused, and FoCal measured the sharpness of the result.
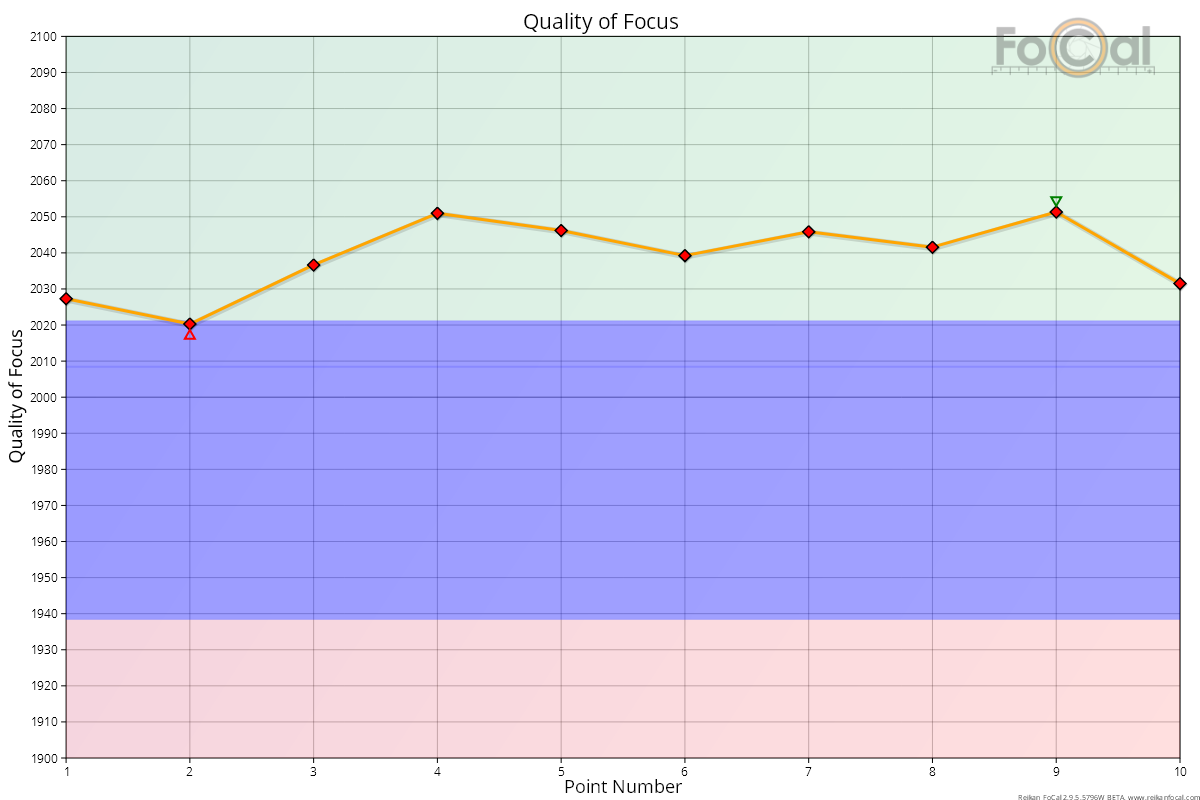
How to read it
- X axis: the point number through the test (1, 2, 3...).
- Y axis: Quality of Focus. Higher is sharper.
- Diamonds and line: the quality of each measurement. Each data set has its own colour (the first is red, then orange, green, blue and grey), named in the legend. A data set is one combination of autofocus type and defocus, for example "PDAF, Far (Max)". You only see more than one when the Autofocus Mode or Defocus Direction setting is Both.
- Triangles: the highest and lowest values in each data set.
Where FoCal Comparison Data is available for your camera and lens, coloured bands show how your sharpness compares with other users:
- Green: better than typical (above the upper quartile).
- Blue: typical (the middle half of results).
- Red: worse than typical (below the lower quartile).
What good looks like
The points sit close together. On a solid tripod with steady light, a good camera and lens usually varies by a few tens of Quality of Focus points from shot to shot. The example above varies by about 30 points and gave a Consistency of Focus of 99.4%, which is a very good result.
The chart scales itself to fill the available height, so a small spread can look large. Always read the numbers on the Y axis before deciding the results vary a lot.
If it looks wrong
- Points widely spread, or a few much lower than the rest: check the setup first. Use a solid tripod and steady, bright lighting, and make sure nothing moved during the test. Then run the test again.
- All points low, or in the red band: the camera may need calibrating. This test uses the camera's current AF Microadjustment / AF Fine Tune, so an uncalibrated lens gives lower sharpness. Run a Focus Calibration (or check with Calibration Check), then repeat this test.
- Still poor after calibration and a good setup: check the other charts, and compare with another lens on the same camera. Repeated poor results can point to a problem with the lens or the camera's autofocus.
Further details
FoCal Comparison Data
The bands compare the sharpness of your shots with results from other FoCal users of the same camera and lens. They use comparison data for the whole zoom range of the lens, not just the focal length you tested. The example above shows a well calibrated lens with every point in the green band, so it is sharper than most other users' results.