Image Motion – MultiTest
(See Chart Features for general chart features - changing scales, copying to clipboard etc)
What this shows
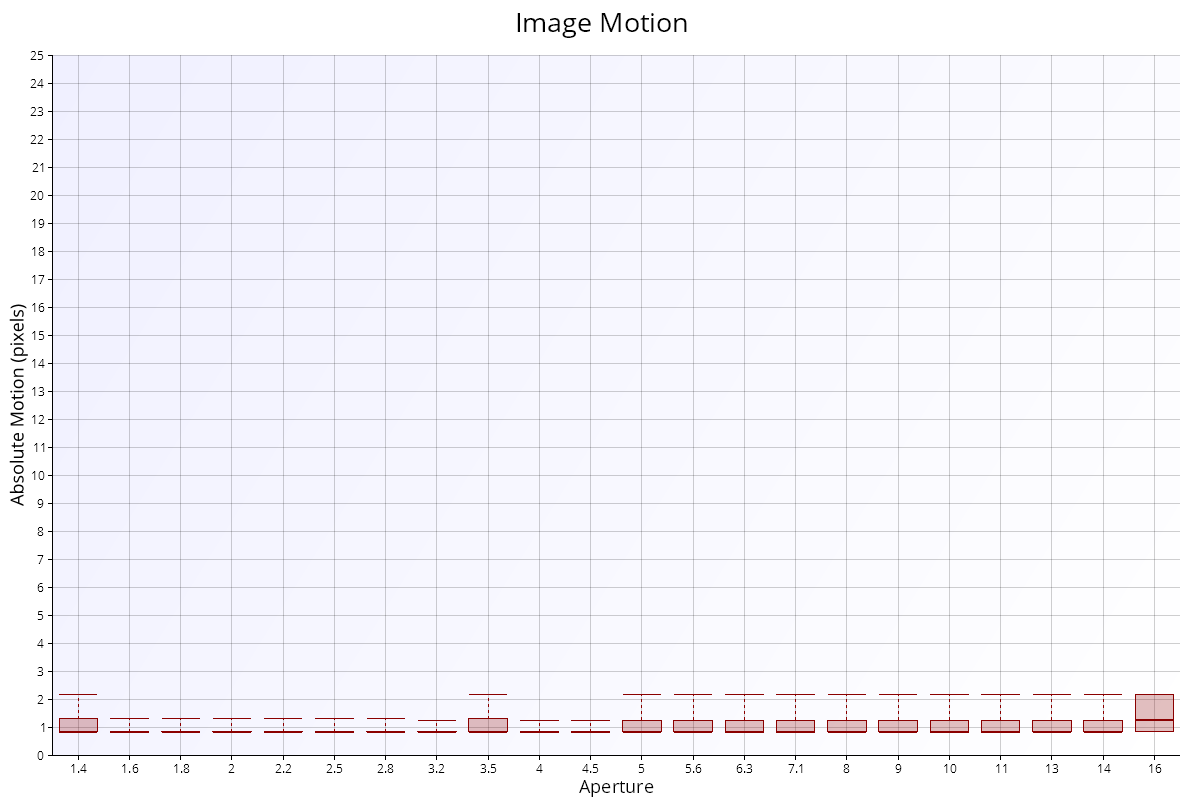
The Image Motion chart shows how much the image of the FoCal target moves on the sensor during the test, at each aperture. When a lens focuses or changes aperture, its internal parts move, and the image can shift slightly. A good lens in good condition moves the image very little.
How to read it
- X axis: aperture, from wide open on the left.
- Y axis: absolute motion in pixels. Each value is how far the image sits from its average position across the test. The value has no direction: it is just the distance.
- Box plot at each aperture:
- Whiskers (top and bottom bars): the largest and smallest motion.
- Box: the middle 50% of the shots (the interquartile range), the typical motion.
- Thick bar inside the box: the median.
The Image Motion (2D) chart shows the same movement as a path on the sensor, so you can see its direction.
What good looks like
Small boxes, low on the chart. In the example above the typical motion is about 1 pixel or less at every aperture.
If it looks wrong
- Typical motion above about 3 to 5 pixels: the lens may have misaligned optics or a problem with its aperture mechanism. Run the test again to check it repeats.
- Long whiskers with small boxes: one or two shots moved much more than the rest. The camera or target probably moved during those shots. Check the tripod, the floor and the target mounting.