Image Motion – AF Consistency
On this page
(See Chart Features for general chart features - changing scales, copying to clipboard etc)
What this shows
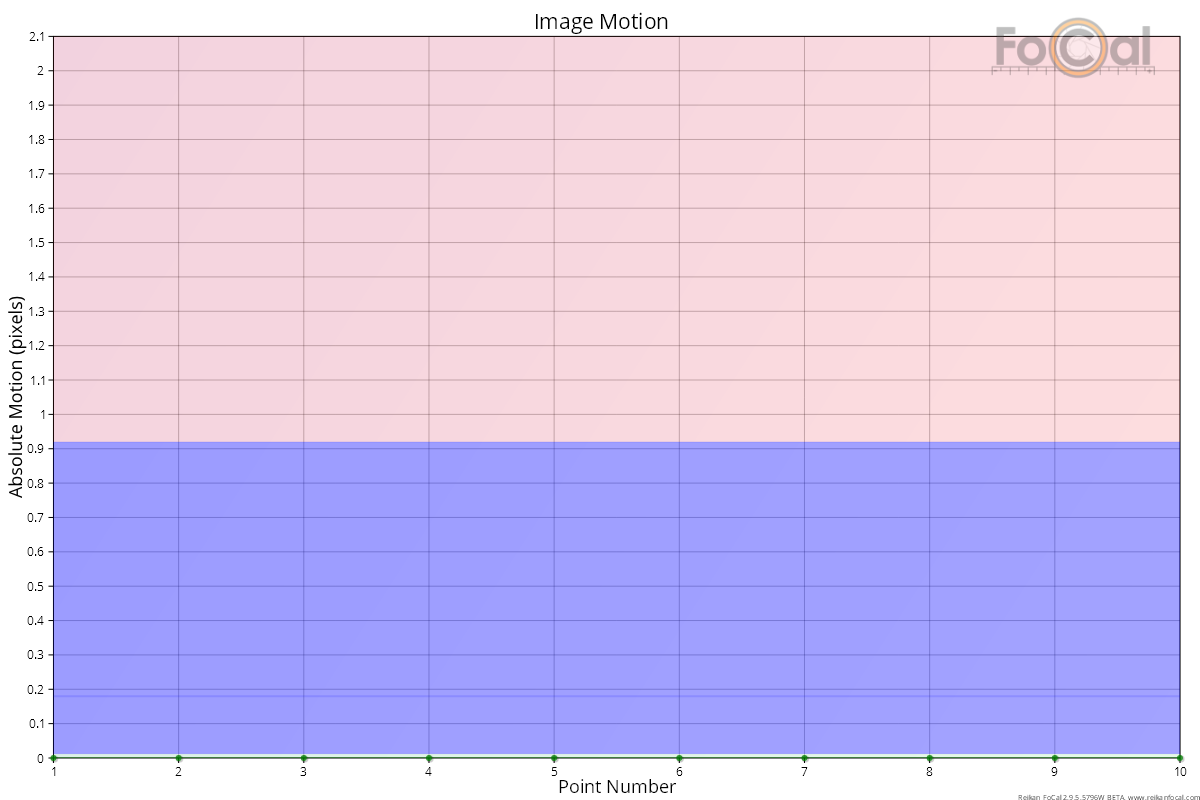
The Image Motion chart shows how much the image of the FoCal target moves on the sensor during the test. When a lens focuses, its internal elements move, and the image can shift slightly. A good lens in good condition moves the image very little.
How to read it
- X axis: the point number through the test.
- Y axis: absolute motion in pixels, from 0 to 25. In AF Consistency, each value is how far the image sits from its average position across the test. The value has no direction: it is just the distance.
- Diamonds and line: the image motion of each measurement. Each data set (autofocus type and defocus) has its own colour, named in the legend.
Where FoCal Comparison Data is available for your camera and lens, coloured bands show how your result compares with other users:
- Green (bottom): less motion than typical.
- Blue: typical (the middle half of results).
- Red (top): more motion than typical.
The Image Motion (2D) chart shows the same movement as a path on the sensor, so you can see its direction.
What good looks like
Image motion is well under 10 pixels, and usually under a pixel or two. The example above shows almost no movement at all.
If it looks wrong
- One or two points much higher than the rest: the camera or target probably moved during those shots. Check the tripod, the floor and the target mounting, then run the test again.
- High motion on every point, repeated across tests: the lens may have misaligned optics, or a front element that rotates or shifts as it focuses (common on older or lower-cost designs). Compare with another lens on the same camera to rule out the setup.
Further details
FoCal Comparison Data
In the example above the points sit at the very bottom of the chart, inside a thin green band. The lens moves the image less than most other users' copies of this lens on this camera.