Stops Improvement – Stabilisation Test
(See Chart Features for general chart features, such as changing the scale and copying to the clipboard.)
The Stops Improvement chart (Stops Improvement (Handheld) in the chart list) shows the overall performance of the stabilisation system, measured in stops.
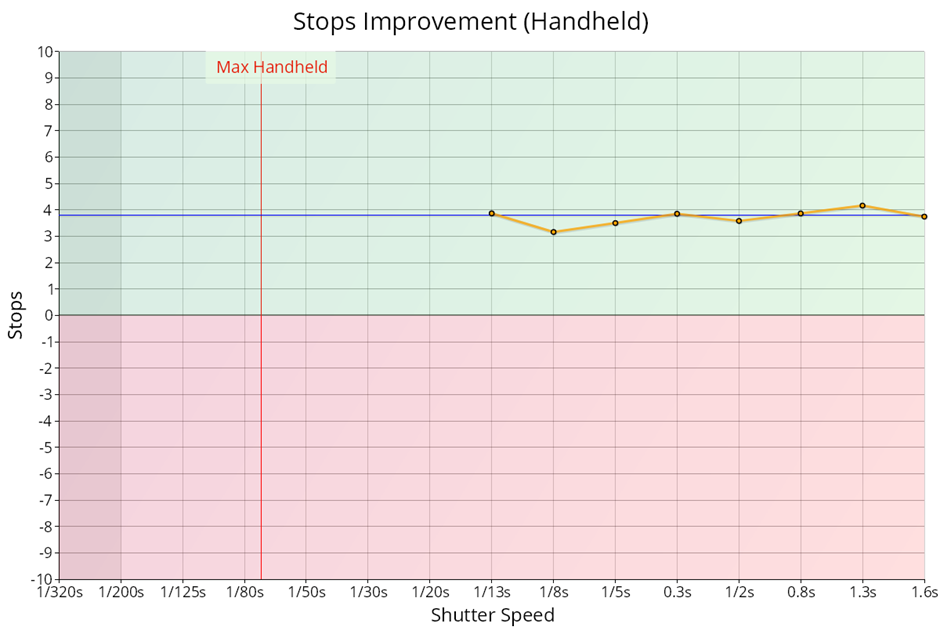
Key:
- Orange line: number of stops between similar quality points with stabilisation enabled and disabled. The specified shutter speed is the speed with stabilisation enabled.
- Blue line: median stops improvement across the whole shutter speed range.
In the example above, taking 1/2s as an example, this shows an improvement of just around 4 stops, which means 1/2s exposure with stabilisation enabled should give the same sort of quality as 1/30s exposure with stabilisation disabled (a 4 stop improvement).
To show what this looks like, here are crops from the same test. On the left is a 1/30s exposure with stabilisation off; on the right, a 1/2s exposure (4 stops slower) with stabilisation on. They're not identical, but the quality is similar:
| 1/30s exposure, stabilisation off | 1/2s exposure, stabilisation on |
 |  |
For comparison, here is the 1/2s exposure with stabilisation off: