Quality – Stabilisation Test
(See Chart Features for general chart features, such as changing the scale and copying to the clipboard.)
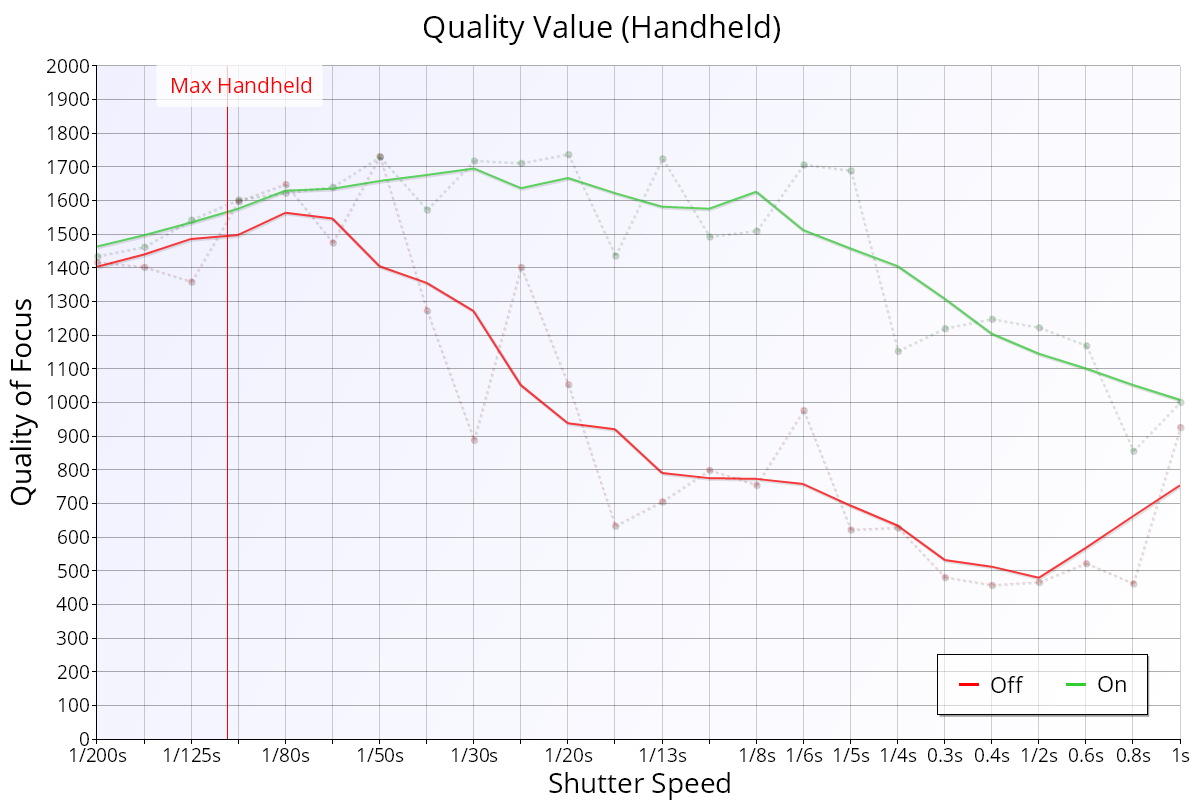
The Quality chart (Quality Value (Handheld) and Quality Value (Tripod) in the chart list) shows the Quality of Focus measured at each shutter speed, with stabilisation on and off. There are separate charts for handheld and tripod shots.
Key:
- Green line: smoothed measurements with stabilisation ON
- Red line: smoothed measurements with stabilisation OFF
- Small points/dotted lines: actual measured values
The red Max Handheld marker shows roughly the slowest shutter speed for sharp handheld images without stabilisation. It's based on the 1/focal length rule, adjusted for sensor size.
Interpretation
The important thing on this chart is the difference between the red (stabilisation off) and green (stabilisation on) lines.
The test changes the ISO and aperture to cover the widest possible range of shutter speeds. Changing the ISO and aperture also changes the Quality of Focus measured, which is why the values drop at both ends of the chart, even on a tripod.
In the example above, there's little difference between the red and green lines from 1/200s to around 1/60s: at these speeds, stabilisation isn't doing much for image quality.
As the shutter speed gets slower, the gap widens: the shots with stabilisation on are much sharper.
The effectiveness charts show this more clearly: Handheld Effectiveness – Stabilisation Test and Tripod Effectiveness – Stabilisation Test.