Results Progression – AF Consistency
On this page
(See Chart Features for general chart features - changing scales, copying to clipboard etc)
What this shows
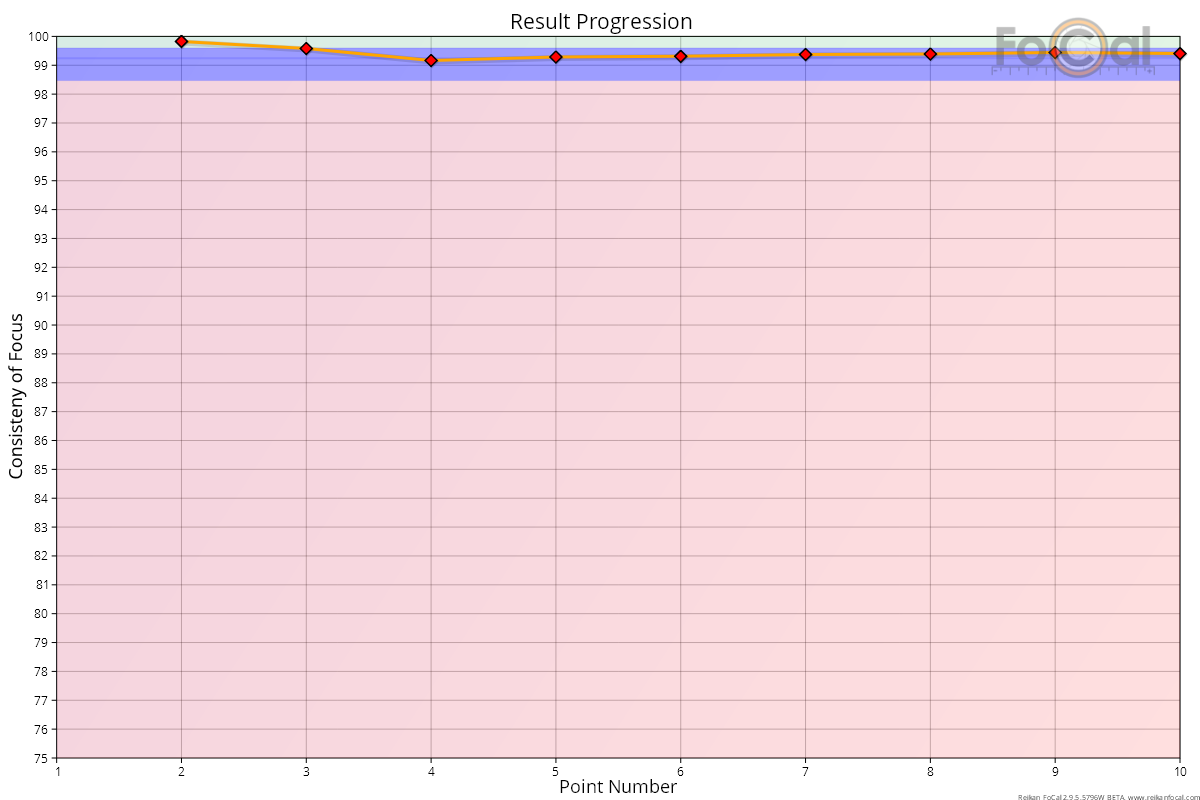
The Result Progression chart shows how the Consistency of Focus result builds up through the test. Each point is the Consistency of Focus calculated from all the measurements up to that point. This is the chart shown on the Summary tab.
How to read it
- X axis: the point number through the test.
- Y axis: Consistency of Focus, from 75% to 100%. Higher is more consistent.
- Diamonds and line: the running Consistency of Focus result. Each data set (autofocus type and defocus, for example "PDAF, Far (Max)") has its own colour, named in the legend.
- There is no value for the first point: consistency can't be measured from a single shot.
Where FoCal Comparison Data is available for your camera and lens, coloured bands show how your consistency compares with other users of the same autofocus type (phase detect or live view):
- Green: better than typical (above the upper quartile).
- Blue: typical (the middle half of results).
- Red: worse than typical (below the lower quartile).
What good looks like
The line settles towards the end of the test, and the final value is high. A good camera and lens usually gives 97% or more; the closer to 100%, the more repeatable the autofocus. If the line is still moving a lot at the last point, more points would give a more reliable result.
If it looks wrong
- Low final value, or in the red band: check the setup (solid tripod, steady and bright lighting, nothing moved) and run the test again. Poor light and low contrast make every autofocus system less consistent.
- A sudden drop part way through: one shot was much worse than the others. Look at that point on the Quality of Focus – AF Consistency chart and its crop image to see whether something disturbed the shot.
- Consistently low: calibrate first. Calibration doesn't change how consistent the autofocus is, but sharpness measurements vary more on a blurred image, so a badly calibrated lens can show lower consistency. Run a Focus Calibration, then repeat this test.
Further details
FoCal Comparison Data
The example above shows a well calibrated lens with a result comfortably in the blue band, so it is typical for this camera and lens.