Autofocus Error – MultiTest
(See Chart Features for general chart features - changing scales, copying to clipboard etc)
What this shows
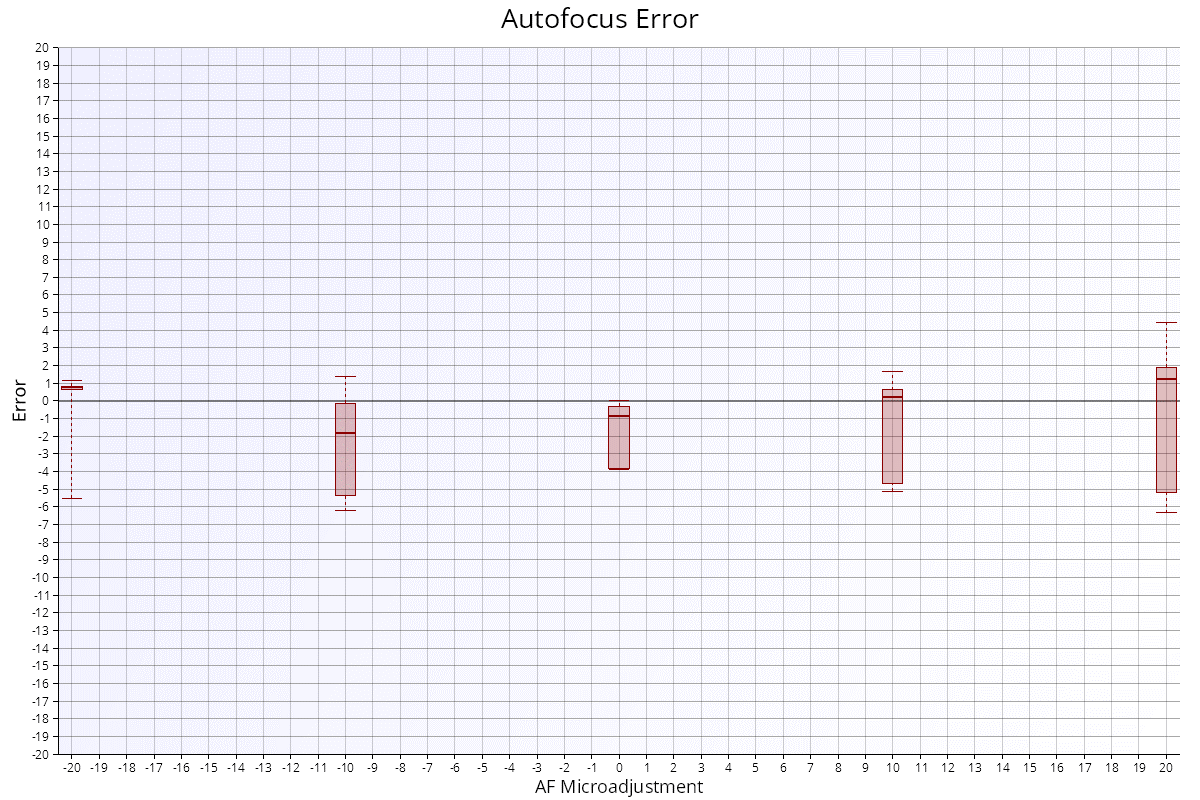
The Autofocus Error chart shows how far the autofocus landed from where it should have, at each focus adjustment value tested. It is shown when the test uses camera focus adjustment.
How to read it
- X axis: the focus adjustment value set on the camera (AF Microadjustment / AF Fine Tune).
- Y axis: focus error, in the same units. 0 means the camera focused exactly where expected.
- Box plot at each value:
- Whiskers (top and bottom bars): the largest errors in each direction.
- Box: the middle 50% of the shots (the interquartile range).
- Thick bar inside the box: the median error.
FoCal works out each error from the sharpness of the shot and the lens's calibration curve, so it can only be calculated once enough data has been collected.
This is not the value to enter in the camera. It shows how accurately the camera and lens focus on any one shot.
What good looks like
Small boxes close to 0, with short whiskers. Every focus operation has some error, so a box spanning a unit or two is normal.
If it looks wrong
- Long whiskers with a small box: most shots were accurate but one or two were well off. In the example, at -20 (far left) the error ranges from -5.5 to about +1, but most shots are within the small box between 0 and +1. That is very good performance with one unusual shot.
- Large boxes: focus varies a lot from shot to shot. At +20 (far right) in the example, the box runs from about -5 to +2, and the whiskers are wider still. Check the setup and the light, and see the AF Consistency test for a closer look at consistency.
- Boxes consistently above or below 0: the autofocus tends to land on one side of the best focus.