Dust Spot Aperture Range – Dust Analysis
What this shows
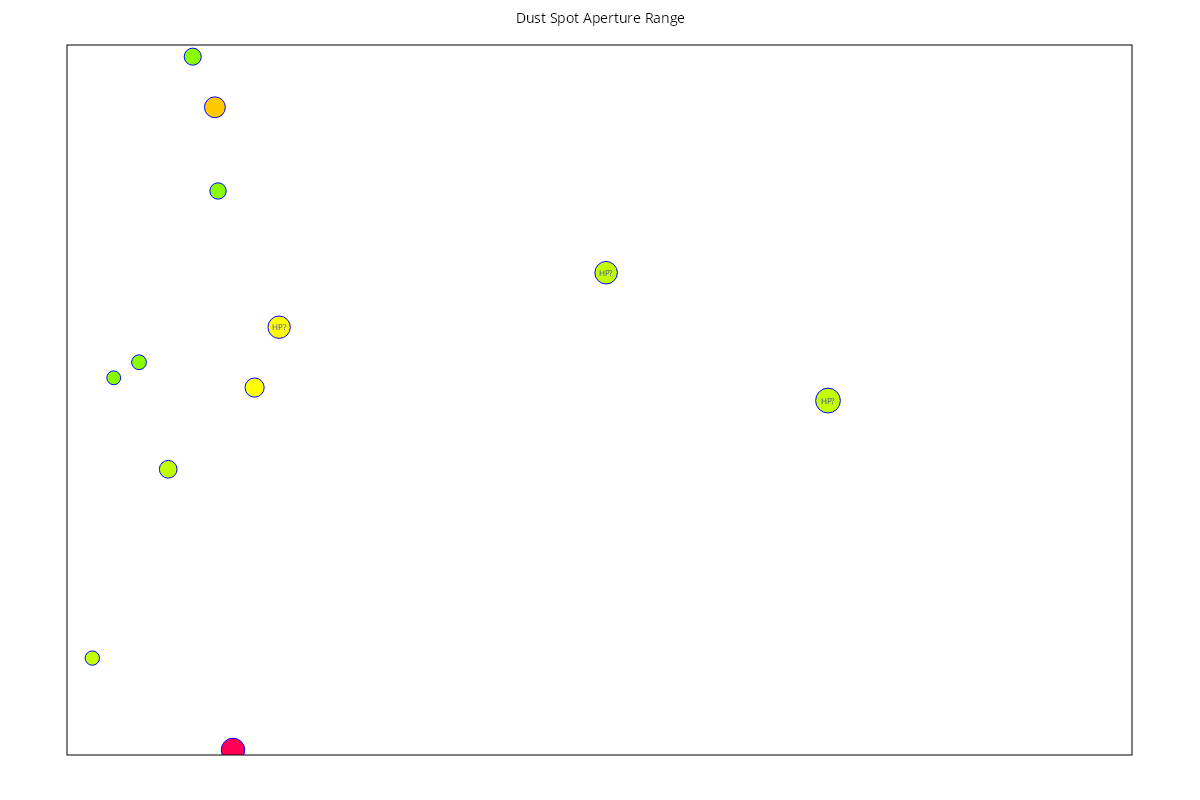
The Dust Spot Aperture Range chart is a map of your sensor showing every high-confidence dust spot, coloured by how many of the tested apertures it appears at. This is the chart on the Summary tab.
How to read it
The rectangle represents the image area. The position of each circle is where the spot appears in your pictures.
- Colour shows how many of the tested apertures the spot appears at. Green: only a few. Yellow and orange: more. Red: half or more of the tested apertures.
- Size is proportional to the size of the spot, but drawn much larger than real life so you can see it.
- "HP?" marks a potential hot pixel rather than a dust spot (see Potential Hot Pixels – Dust Analysis).
Click a spot to select it. FoCal outlines it, shows the aperture range it appears at, and shows a crop of the image so you can see the spot itself. Crops are only available if Save Captured Image Files was on when the test ran (see Settings – Dust Analysis).
FoCal only shows a spot when it appears in the same place across several apertures. Marks that appear once, or move around, are ignored.
What good looks like
- Few spots, and mostly green ones. Green spots usually only show in pictures taken at small apertures (large f-numbers).
- Red spots appear across a wide range of apertures, so they are the most likely to show in your pictures.
If it looks wrong
- Red or large spots: click them to check the crop. If they are real, clean the sensor and run the test again.
- Spots in the same place on every test after cleaning: the mark may be stuck, or on the rear of the lens. Try another lens to check.