Historic Results - Fully Auto Calibration
(See Chart Features for general chart features - changing scales, copying to clipboard etc)
What this shows
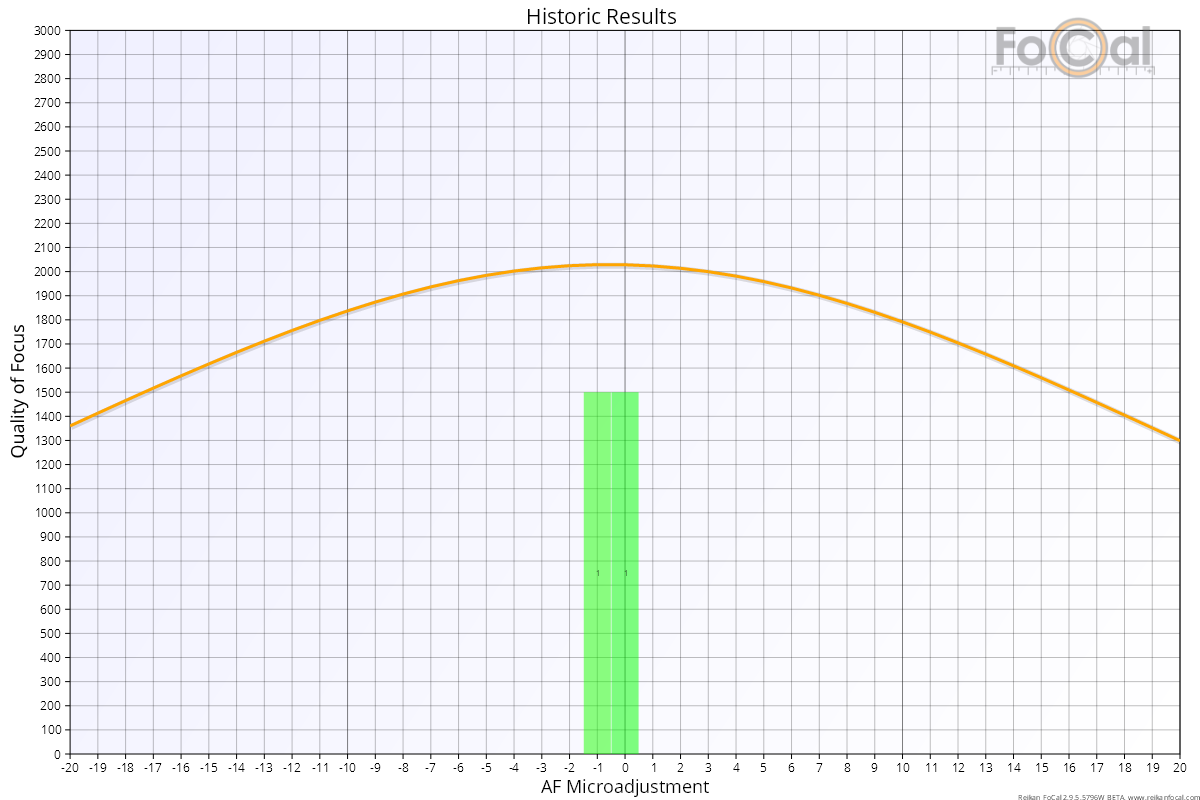
The Historic Results chart compares this test's result with your earlier Fully Auto calibrations of the same camera and lens. It helps you see whether the lens is behaving as it did before.
How to read it
- Horizontal axis: the Focus Adjustment value, usually -20 to +20.
- Vertical axis: Quality of Focus (sharpness) for the curve. The bars use their own scale: only their relative height matters.
Key:
- Grey bars: the results of your earlier tests with this camera and lens at a similar focal length. The taller the bar, the more often that value was the result.
- Orange curve: this test's Lens Profile. Its highest point is this test's result.
- Red vertical line: this test's calibration result.
What good looks like
- The earlier results are grouped closely together.
- This test's result sits in or next to the group of earlier results.
In the example above, two earlier tests gave results of 0 and -1. The peak of this test's curve is close to them, so the lens is behaving as it has before.
If it looks wrong
- Earlier results spread widely: the results haven't been repeatable. Check your setup, run the test again, and look at the Focus Consistency - Fully Auto Calibration chart. A lens that never gives a consistent result may have a fault.
- This result far from all the earlier ones: something has changed. The lens may have been knocked, or the camera or lens firmware may have changed. Run the test again to confirm, then investigate.