Potential Hot Pixels – Dust Analysis
What this shows
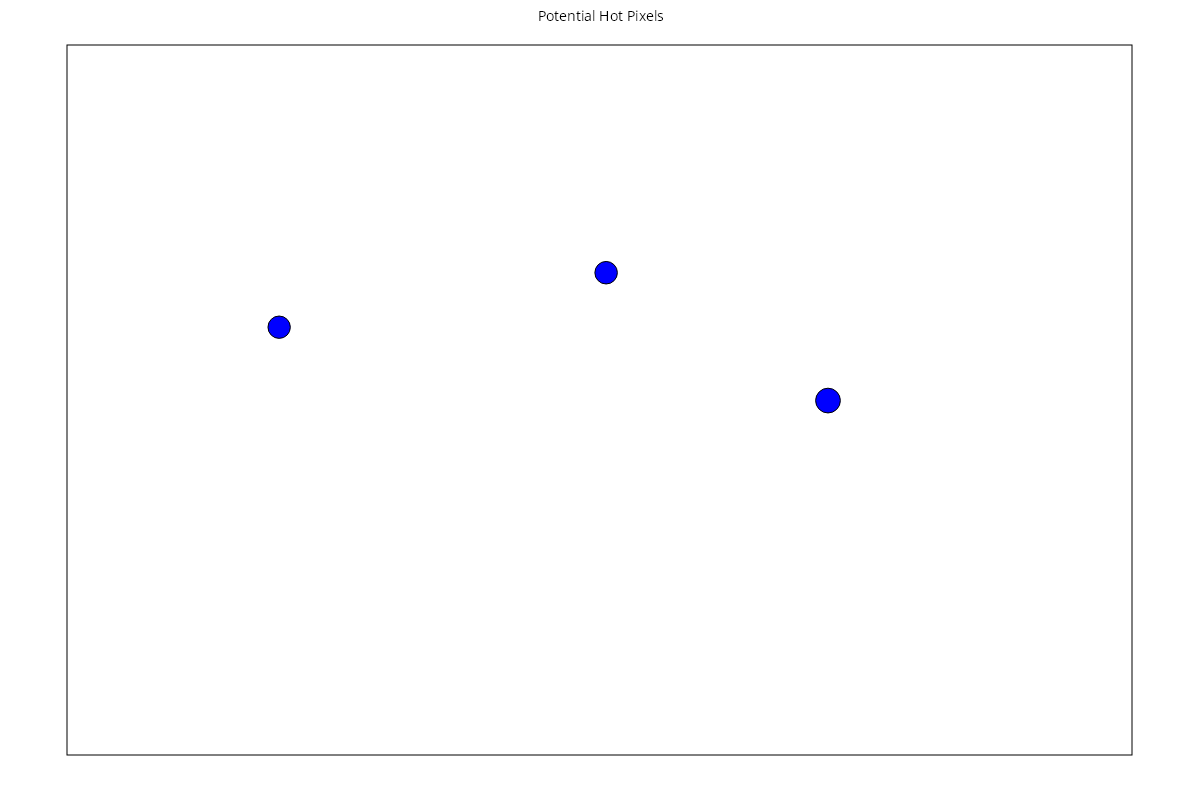
The Potential Hot Pixels chart is a map of your sensor showing pixels that may be stuck bright ("hot" pixels), rather than dust.
How to read it
The rectangle represents the image area. Each blue circle is a potential hot pixel, drawn much larger than real life so you can see it.
FoCal marks a point as a potential hot pixel when it is consistently brighter than its surroundings (dust makes a spot darker) and it appears at several apertures.
Click a point to select it. FoCal outlines it in red, shows the aperture range it appears at, and shows a crop of the image. Crops are only available if Save Captured Image Files was on when the test ran (see Settings – Dust Analysis).
What good looks like
No points, or only a few. Most sensors have a few hot pixels, and most cameras hide them in normal pictures.
If it looks wrong
- This detection isn't 100% reliable. Before assuming a pixel is stuck, look at the crop, and check the same place in your own pictures (long exposures and high ISO show hot pixels most).
- The Potential Hot Pixel Count on the Details tab is highlighted as a warning when it is above 10.
- Many cameras have a pixel-mapping or sensor-cleaning function that can hide hot pixels. Check your camera's manual, or ask the manufacturer's service centre.