Aperture Range Quality Score (ARQS) – MultiTest
(See Chart Features for general chart features - changing scales, copying to clipboard etc)
What this shows
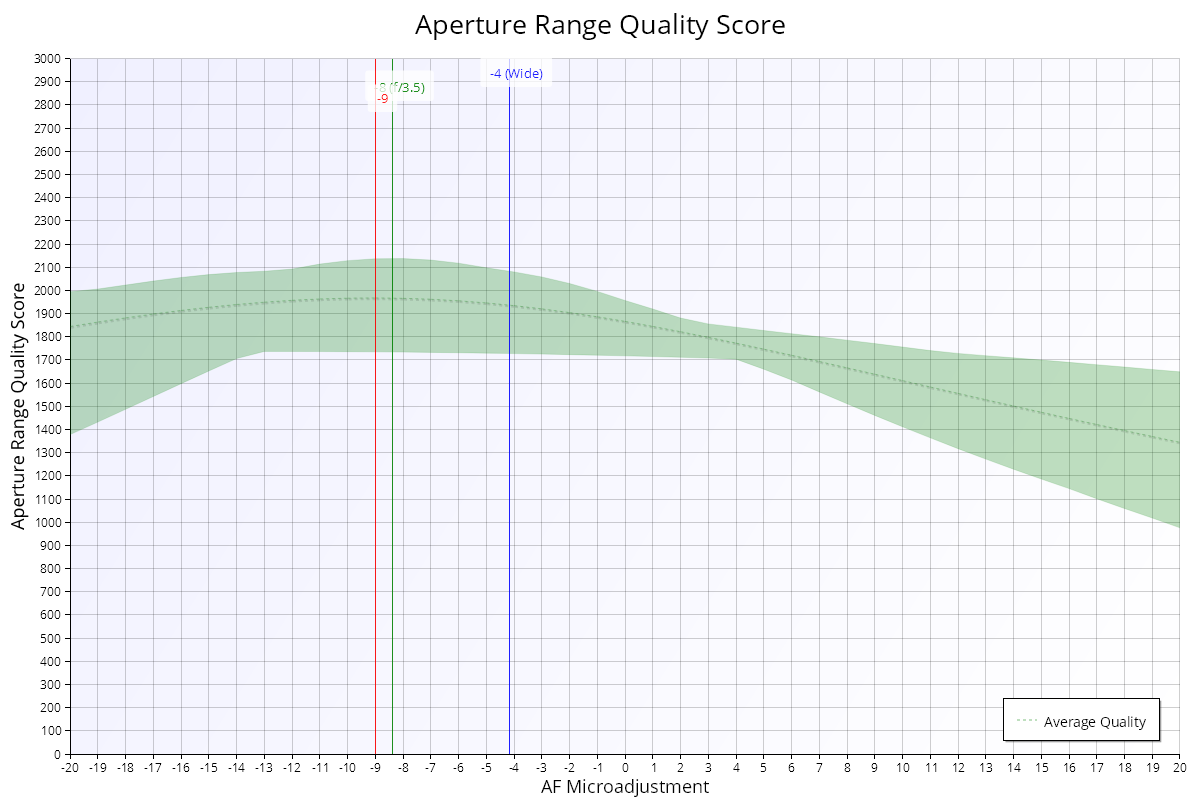
The Aperture Range Quality Score (ARQS) chart shows, for each focus adjustment value, how good the image quality is across the whole aperture range. It helps you choose a calibration value that works well at all apertures, not just wide open. The chart is shown when the test uses camera focus adjustment.
How to read it
- X axis: the focus adjustment value (AF Microadjustment / AF Fine Tune).
- Y axis: quality.
- Green area: the range from the lowest to the highest quality across all tested apertures, at each focus adjustment value. Not every value is measured, so FoCal fills in between the measured points.
- Dashed line inside the green area ("Average Quality"): the average quality across all apertures. This is the Aperture Range Quality Score.
- Blue line ("Wide"): the best focus adjustment wide open, the "classic" calibration value.
- Green line: the focus adjustment for the single best point of the test. Its label shows the aperture of that point (f/3.5 in the example).
- Red line: the focus adjustment with the highest average quality across all apertures (the peak ARQS).
What good looks like
The blue and red lines are close together. Then the wide-open calibration value also gives good results when you stop down.
The top of the green area is highest at the green line, which marks the best quality at any aperture and focus.
If it looks wrong
The red line is often a few units away from the blue line, because of focus shift. Setting the camera to the ARQS value usually costs a little sharpness wide open, but gives better results when stopped down. If you rarely shoot wide open, it can be a good compromise calibration.
See Aperture Sharpness Profile – MultiTest for how the two values compare at each aperture.