Focus Consistency - Fully Auto Calibration
(See Chart Features for general chart features - changing scales, copying to clipboard etc)
What this shows
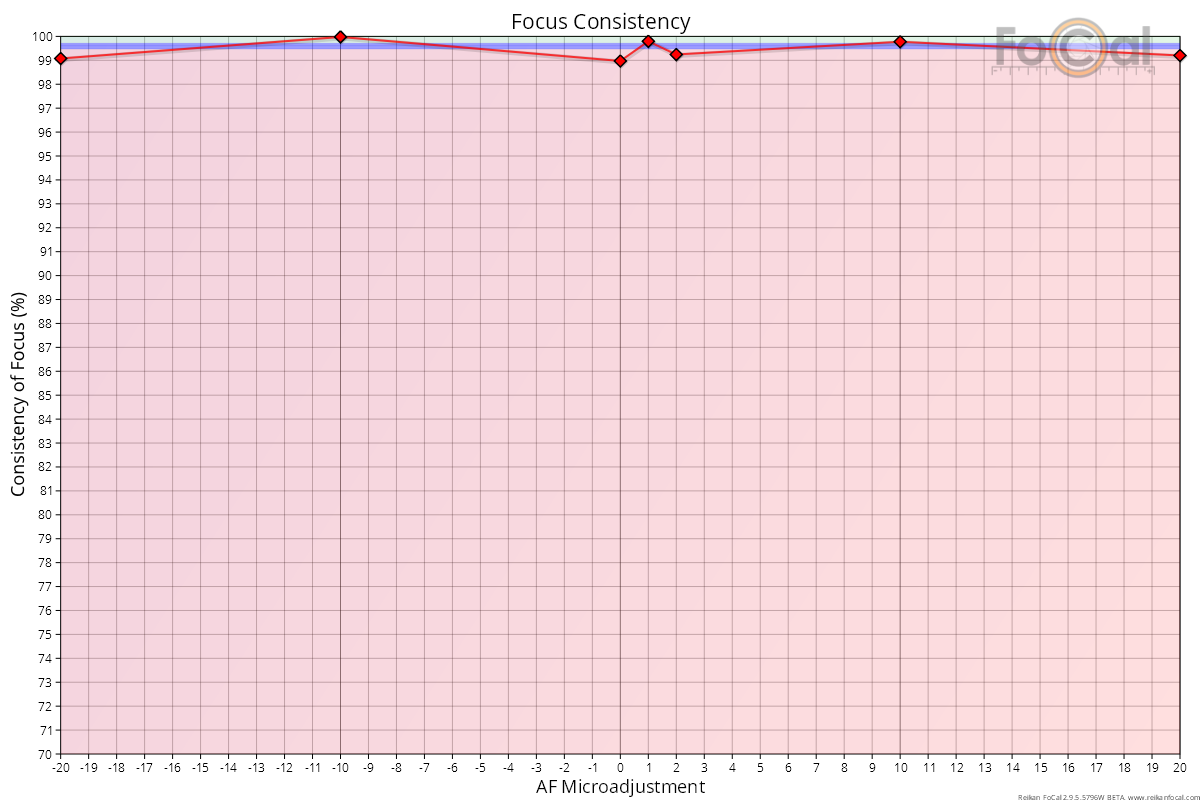
The Focus Consistency chart shows how repeatable the autofocus was at each Focus Adjustment value. FoCal works it out from the spread of sharpness between shots taken at the same value. If every shot were exactly as sharp as the others, the consistency would be 100%.
How to read it
- Horizontal axis: the Focus Adjustment value, usually -20 to +20.
- Vertical axis: Consistency of Focus, from 75% to 100%. Higher is more consistent.
Key:
- Orange line with markers: the consistency at each tested Focus Adjustment value. Green markers were analysed with Target Optimisation on, red markers with it off. (The line takes the channel colour if you choose a single channel; see Lens Profile - Fully Auto Calibration.)
- Black dashed horizontal line: the test's Consistency of Focus result, measured close to the calibration result.
- Red vertical line: the calibration result.
Where FoCal Comparison Data is available for your camera and lens, coloured bands show how your consistency compares with other users:
- Green area: more consistent than typical.
- Blue area: typical. The middle half of other users' results (between the first and third quartiles).
- Red area: less consistent than typical.
What good looks like
- Values close to 100%, especially near the calibration result. Consistency far from the result matters less, because those shots are out of focus anyway.
- As a guide, FoCal scores a Consistency of Focus result above about 99.0% as acceptable, above about 99.4% as good and above about 99.7% as excellent. With comparison data, the score compares you with other users of the same camera and lens instead.
- If comparison data is shown, the line mostly on or above the blue area. A few points slightly below it are not a problem.
If it looks wrong
- Make sure the light is bright and steady, the camera is on a solid tripod, and nothing is moving the camera or target. Then run the test again.
- If the consistency is still well below typical, run an AF Consistency test to look at the autofocus repeatability in more detail.
Further Details
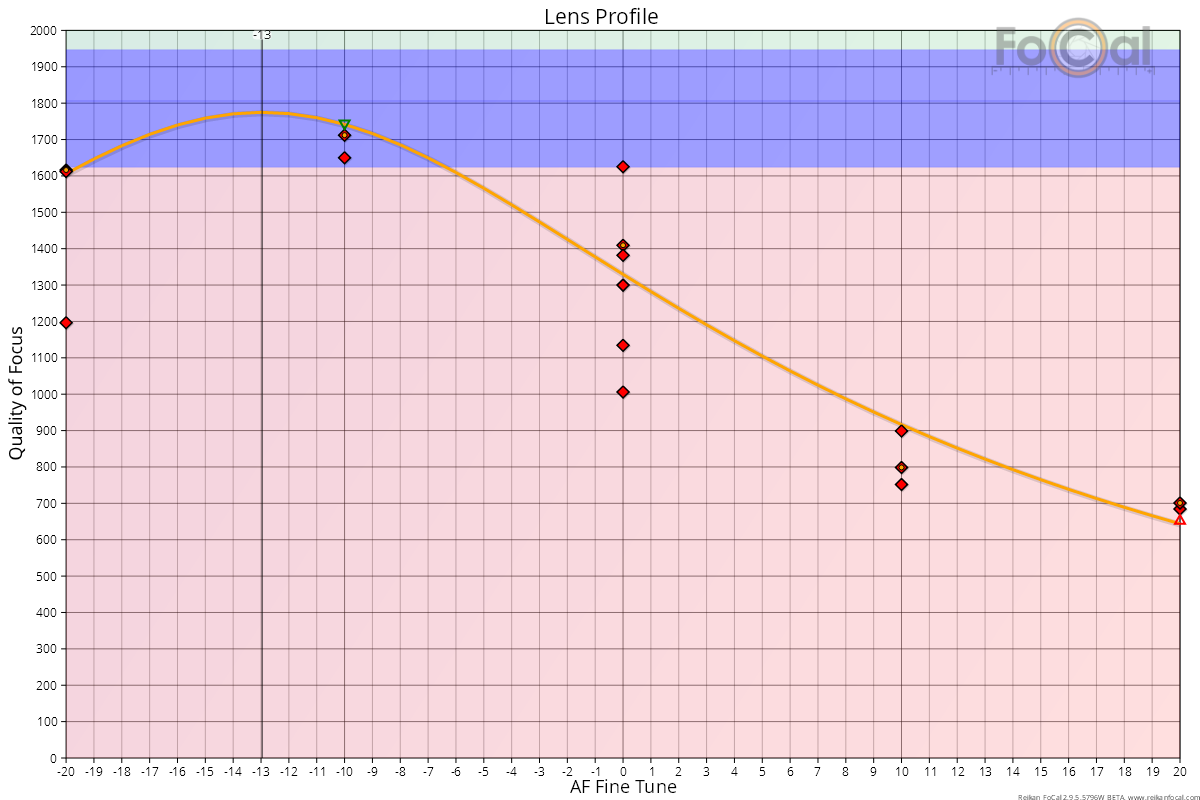
The Focus Consistency chart above comes from the same test as this Lens Profile chart:
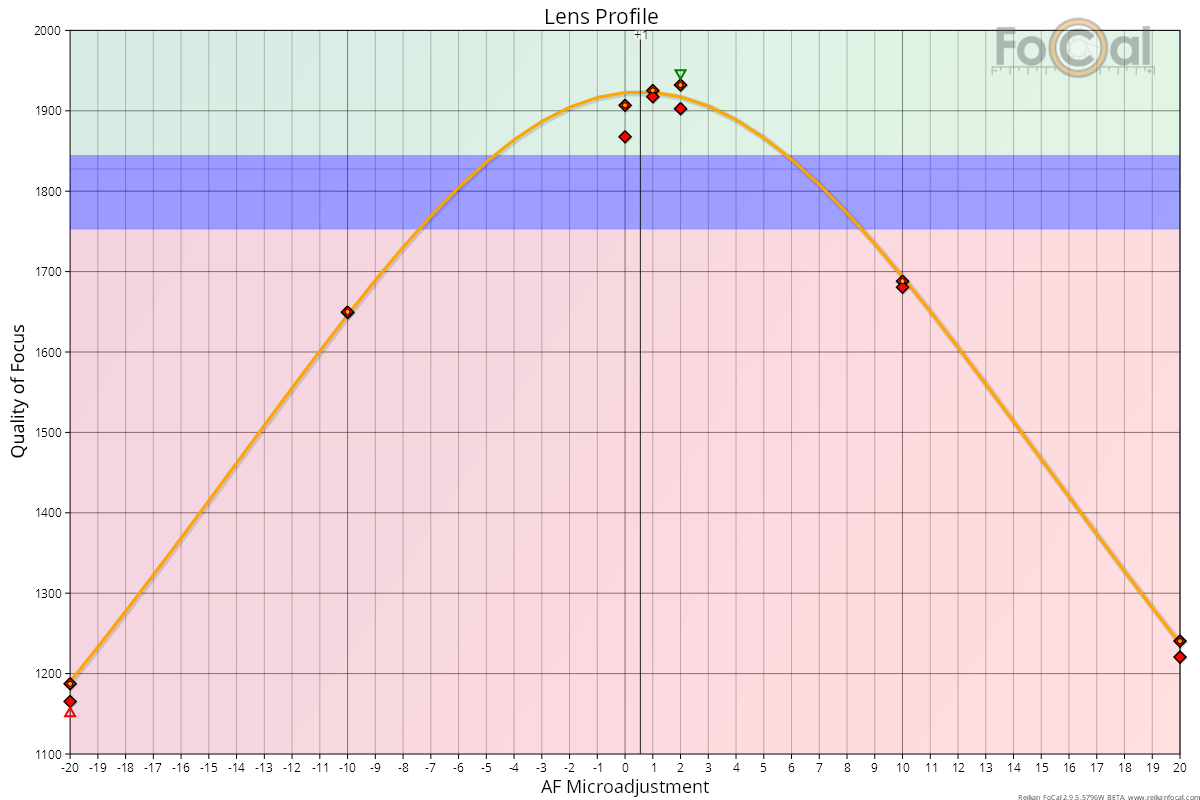
The consistency shows how close together, vertically, the shots at each Focus Adjustment value are on the Lens Profile.
Here is a poorer result:
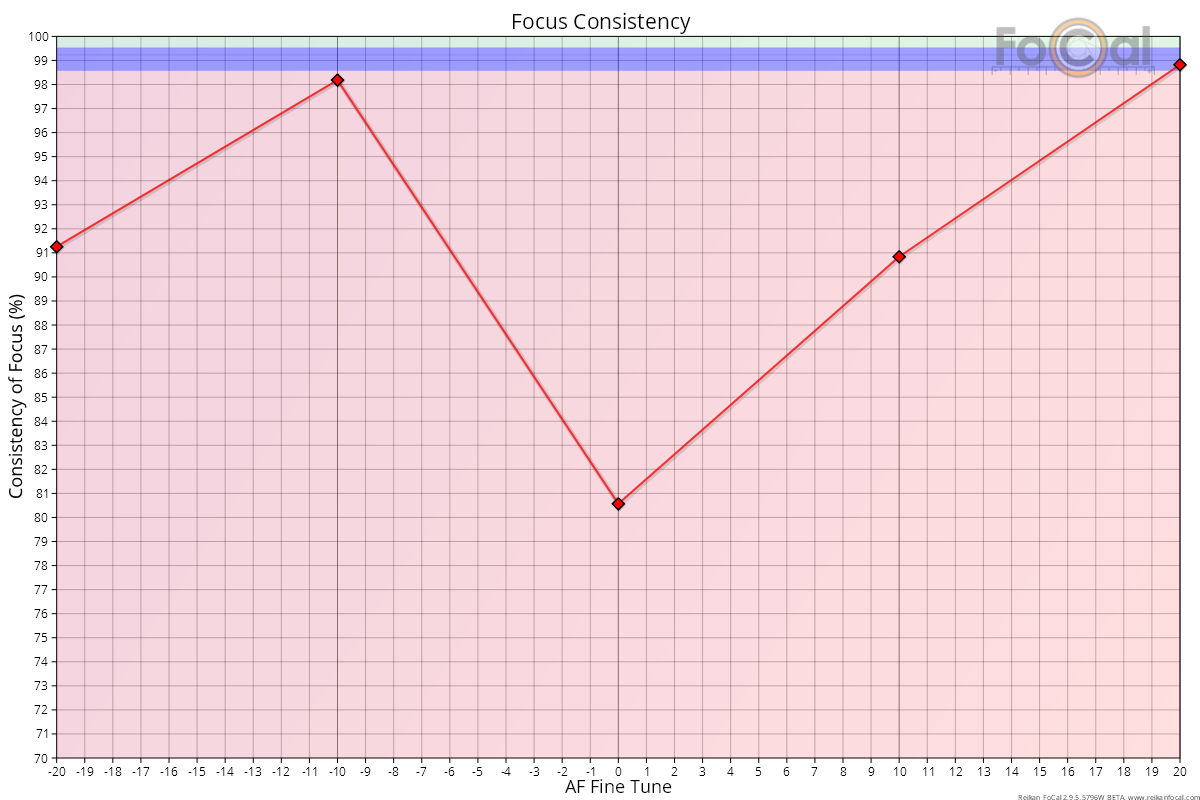
The line drops well away from the top of the chart. The matching Lens Profile shows how spread out the shots are, especially at an AF Fine Tune value of 0: