Quality & Shift – MultiTest
(See Chart Features for general chart features - changing scales, copying to clipboard etc)
What this shows
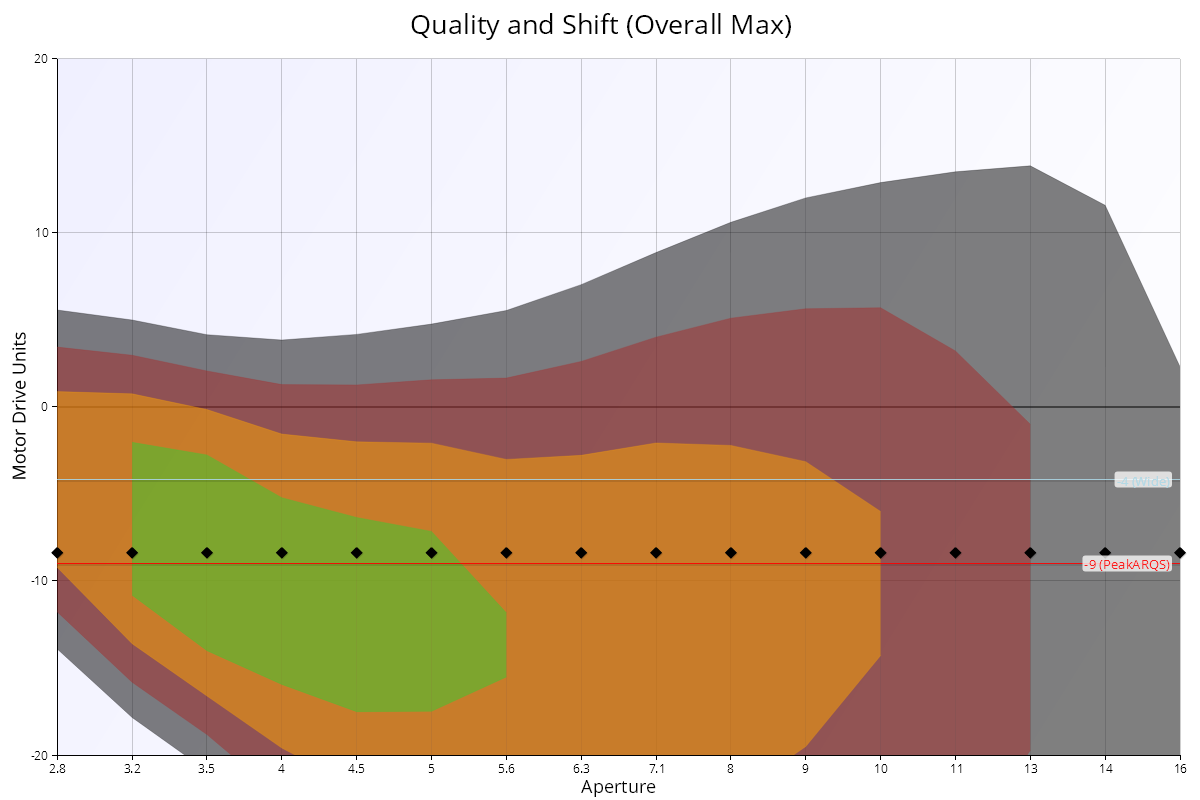
The Quality and Shift chart shows the same data as the Quality Grid – MultiTest, but as bands at 5% steps of quality. It shows how much room for error you have in focus at each aperture, and how the best focus position moves as you stop down.
How to read it
- X axis: aperture, from wide open on the left.
- Y axis: focus position (AF Microadjustment / AF Fine Tune units, or focus offset units in Live View mode, see MultiTest (Live View)).
- Coloured bands: the range of focus positions that give at least a given share of the peak quality:
- Green: 95% to 100%.
- Orange: 90% to 95%.
- Brown: 85% to 90%.
- Grey: 80% to 85%.
- No colour: below 80%.
- Black diamonds: the best focus position at each aperture.
- Light blue line ("Wide"): the best focus position wide open, the "classic" calibration value.
- Red line ("PeakARQS"): the focus position with the best Aperture Range Quality Score, the best average across all apertures (see Aperture Range Quality Score (ARQS) – MultiTest). Only shown when the test uses camera focus adjustment.
There are two versions of the chart:
- Quality and Shift (Overall Max): percentages are relative to the best point of the whole test.
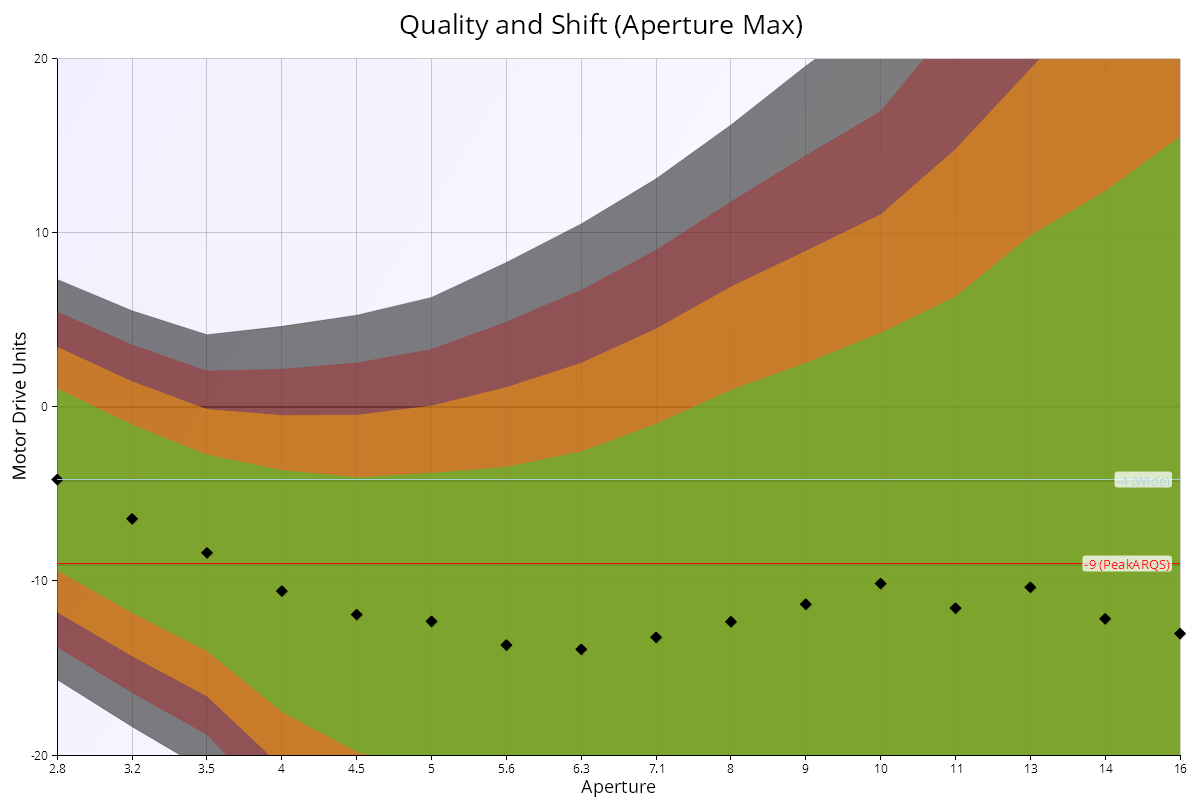
- Quality and Shift (Aperture Max): percentages are relative to the best point at each aperture.
The second example is the Aperture Max view of the same test:
What good looks like
The green band is wide, and it covers the blue line at the apertures you use most. A wide band means small focus errors make little difference. As you stop down, depth of field increases and the bands get wider.
A band that slopes up or down as you stop down shows focus shift.
If it looks wrong
- Narrow or broken bands: some measurements were unreliable. Check the setup and run the test again.
- The blue line falls outside the green band at the apertures you use: consider the ARQS value (red line). See Aperture Range Quality Score (ARQS) – MultiTest.
See Quality Grid – MultiTest for more on reading this type of chart.