Lens Profile – Aperture Sharpness
(See Chart Features for general chart features - changing scales, copying to clipboard etc)
What this shows
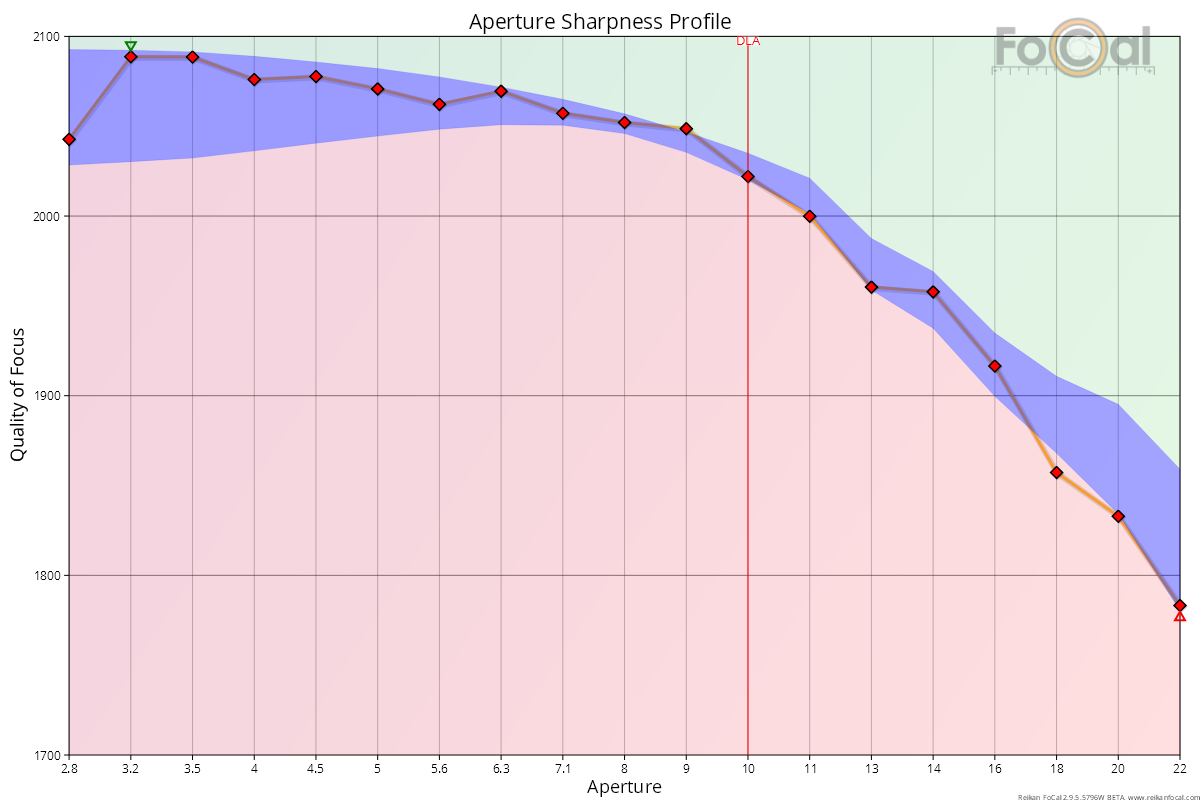
The Aperture Sharpness Profile shows how sharp your lens is at each aperture tested, from wide open to the smallest aperture.
How to read it
- Horizontal axis: aperture. Wide open is on the left (f/2.8 in the example). The aperture gets smaller (larger f-number) towards the right.
- Vertical axis: Quality of Focus, FoCal's sharpness measurement. Higher is sharper.
Key:
- Diamonds: one per shot. Green means the shot was analysed with Target Optimisation, red means without it.
- Orange line: the sharpness profile across the aperture range. If you choose a single colour channel in the Channel box, the line takes that channel's colour.
- Green triangle: the highest value. Red triangle: the lowest value.
- Red vertical line labelled DLA: the diffraction limited aperture for your camera (see below).
Where FoCal Comparison Data is available for your camera and lens, coloured bands show how the shape of your profile compares with other users' results:
- Blue band: typical. The middle half of other users' results (between the first and third quartiles).
- Green area: better than typical.
- Red area: worse than typical.
The bands are scaled to your own result at the comparison data's reference aperture. So they compare how your lens changes across the aperture range, not its absolute sharpness. If the test didn't capture the reference aperture, no bands are drawn.
What good looks like
- Most lenses are sharpest around f/5.6 to f/8.
- Between the sharpest aperture and wide open, a lens that isn't especially fast (slower than about f/1.8) usually shows a small drop or a fairly flat line.
- To the right of the DLA line, sharpness falls with almost every lens. This is diffraction, not a lens fault.
- With comparison data, a good result follows the shape of the blue band and stays mostly inside it. It doesn't need to fit exactly.
If it looks wrong
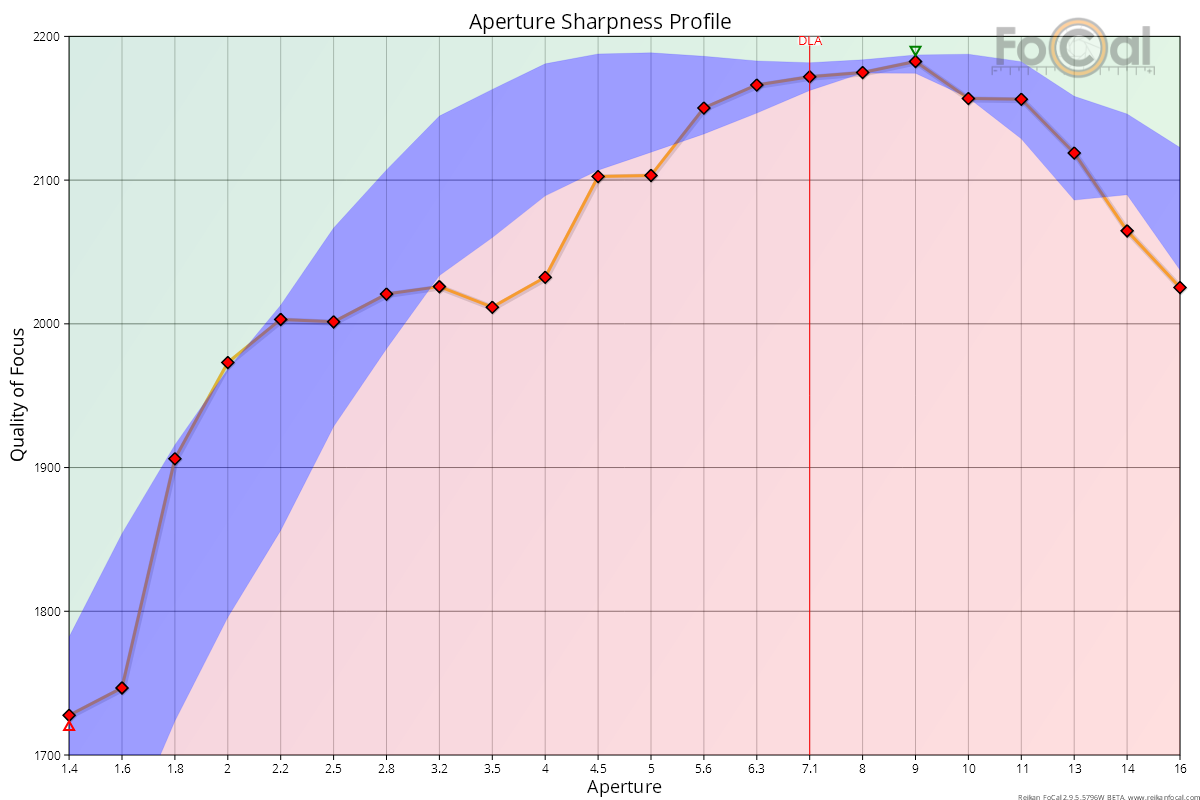
- Odd kinks in the line, or every value low: the lens probably wasn't focused accurately before the test. Aperture Sharpness doesn't refocus between shots. Run Target Setup from the test to set focus again, then repeat the test (see the example below).
- Line well below the blue band across most of the range: repeat the test to rule out a one-off. If it happens again, check the Comparison Data Difference and Astigmatism Factor charts too.
Further Details
Diffraction limited aperture (DLA)
When light passes through a small aperture it spreads out, and the blur covers more than one pixel. The DLA is the aperture where this starts to soften the image. It depends on the pixel size of your camera's sensor: the smaller the pixels, the wider (smaller f-number) the DLA.
FoCal Comparison Data example
In the first example above, the profile sits almost entirely inside the blue band. This lens behaves just like a typical copy across the aperture range. Take note if the line is well below the blue band for most of the chart.
Fast (very wide aperture) lenses
The following chart is typical of a fast lens:
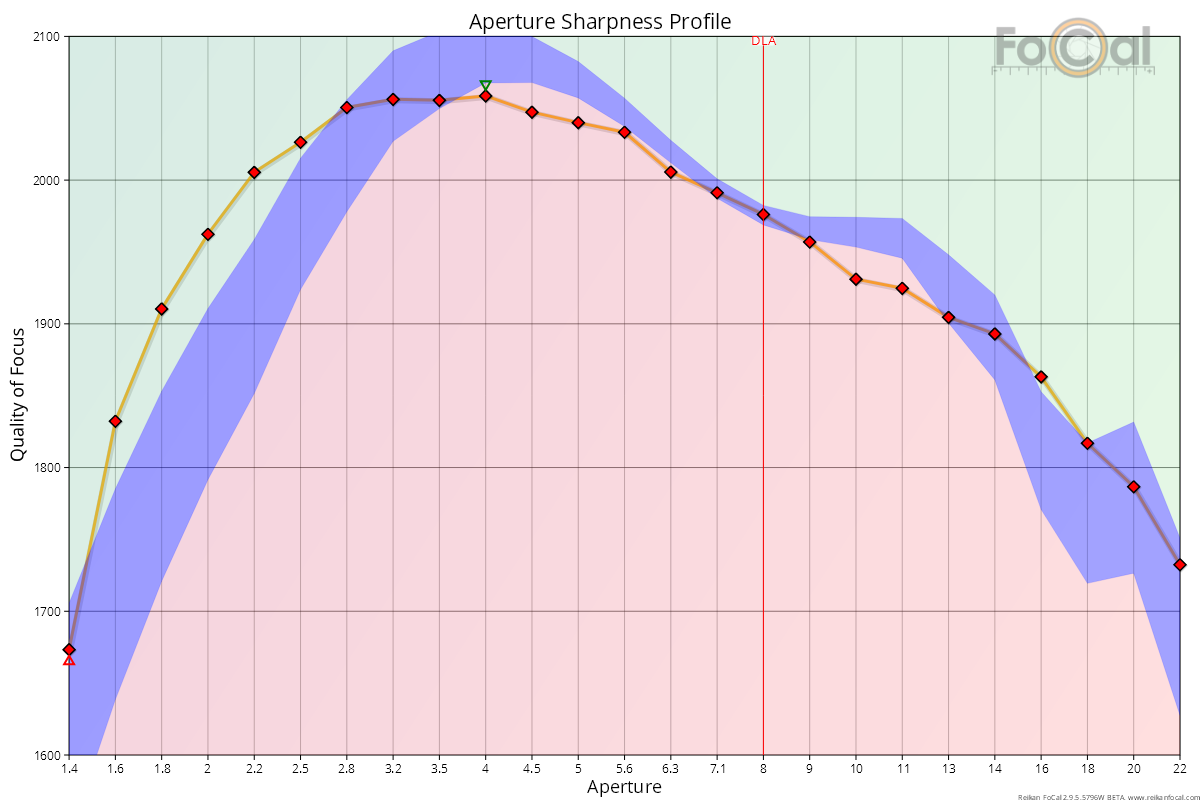
Unlike the first example, sharpness drops sharply on the left, as the lens opens wider than about f/2.8. This is normal for fast lenses: very wide apertures usually cost some sharpness.
Incorrectly focused lens
The test only gives representative results if the lens is focused as accurately as possible on the target before the test runs. Target Setup helps with this, but focusing is manual and can be slightly off.
If focus is a long way from perfect, you may see odd kinks in the line, as in the example below. Check the focus and run the test again. A few lenses do have unusual profiles, but most follow the shapes shown in the first two examples.