Aperture Dust Profile – Dust Analysis
What this shows
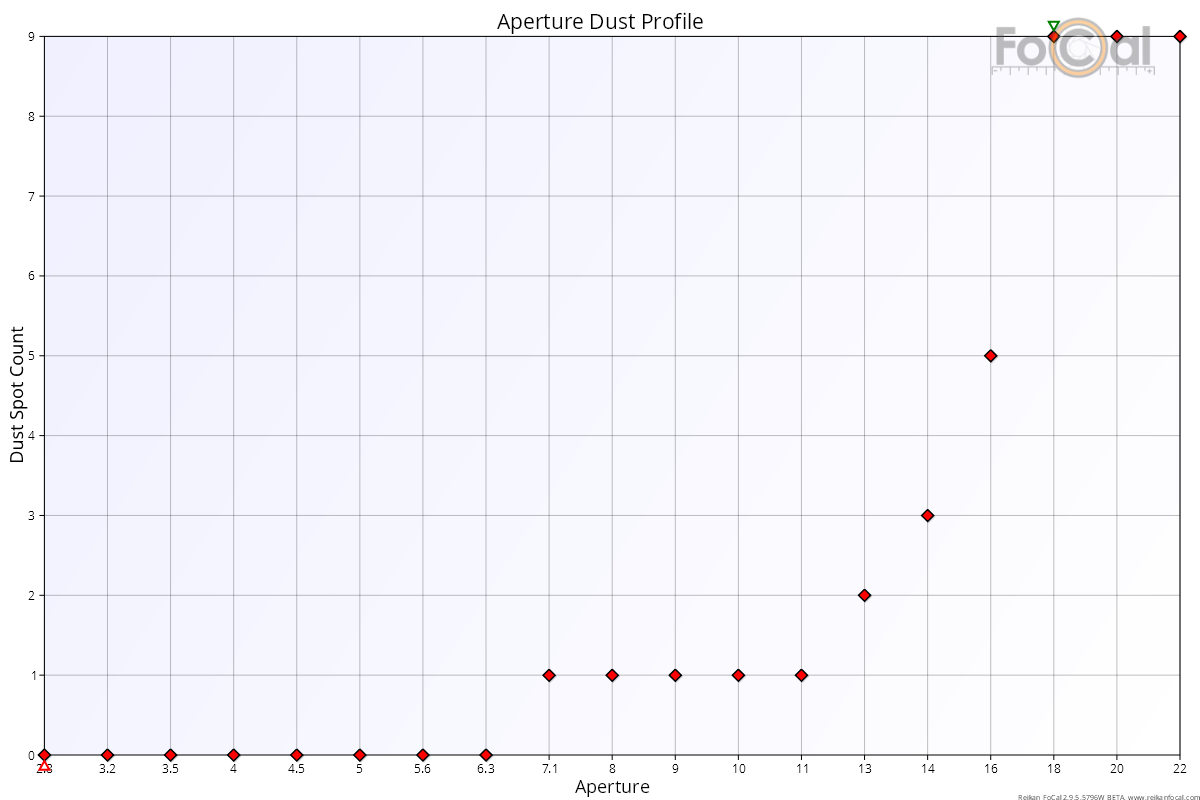
The Aperture Dust Profile shows how many dust spots FoCal is confident about at each aperture tested.
How to read it
- Horizontal axis: aperture. Wide apertures (small f-numbers) are on the left, small apertures (large f-numbers) on the right.
- Vertical axis: Dust Spot Count, from 0 to 50. A value above 50 is shown with a marker at the top edge.
Key:
- Markers: the number of high-confidence dust spots at each aperture.
- Green triangle: the highest count. Red triangle: the lowest count.
FoCal only counts a spot when it appears in the same place across several apertures. Marks that appear once, or move around, are ignored.
This chart only counts spots. It says nothing about their size or how dark they are.
What good looks like
- Few or no spots at the apertures you normally use.
- The count rises towards the smallest apertures. That is normal: dust shows most at small apertures, and spreads out and fades into the background as you open up.
- Even a clean sensor often shows a few spots at the smallest apertures.
If it looks wrong
- Spots at apertures you use often: consider cleaning the sensor, then run the test again to check it worked.
- How much dust you can live with depends on how you shoot. Portraits at wide apertures tolerate more dust than landscapes at small apertures.
- A very high count from the first shots: check the paper or background is plain, evenly lit and out of focus (see Dust Analysis).