Focus Steps – MultiTest
(See Chart Features for general chart features - changing scales, copying to clipboard etc)
What this shows
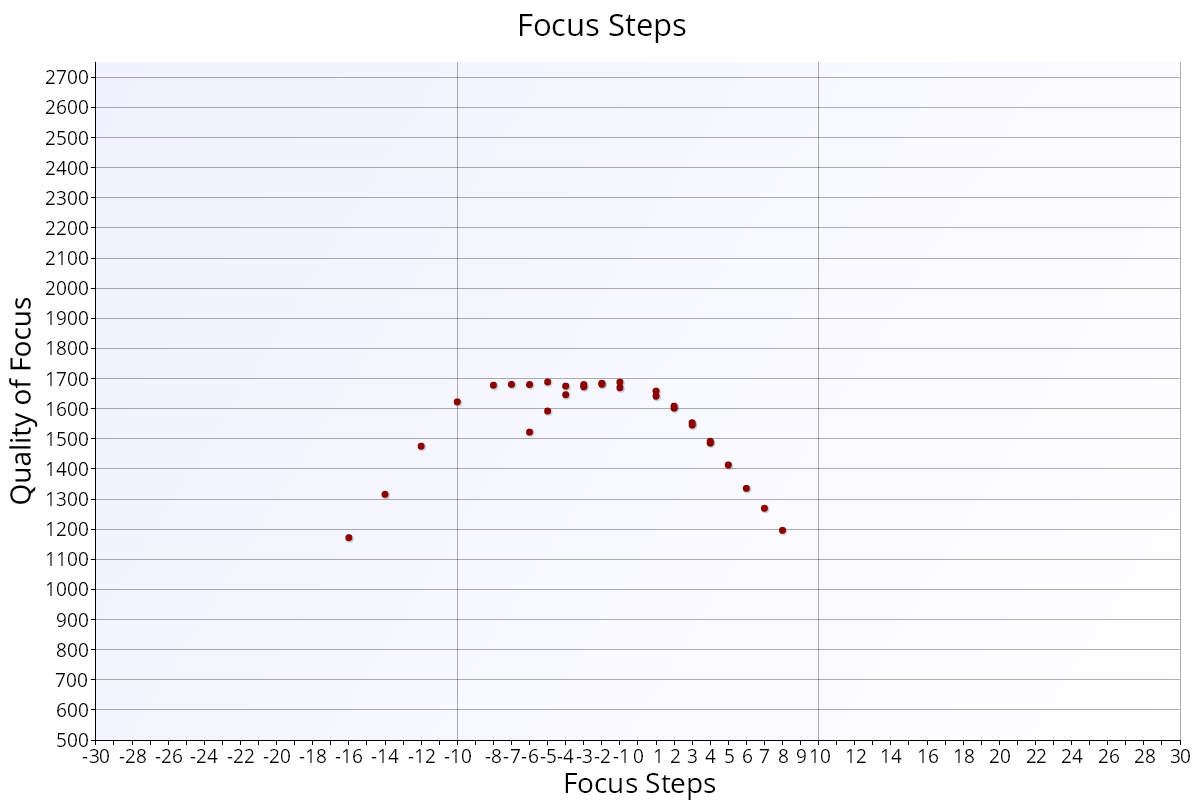
In Live View mode (see MultiTest (Live View)), MultiTest drives the lens focus in small steps away from the live view autofocus position and measures each step. The Focus Steps chart shows the result. It shows whether live view autofocus finds the sharpest point, and whether the lens moves its focus smoothly and repeatably. The chart is only shown for tests run in Live View mode.
How to read it
- X axis: focus steps from the live view autofocus position, from -30 to +30. 0 is where live view autofocus focused. Negative values move focus towards the camera, positive values away from it.
- Y axis: Quality of Focus. Higher is sharper.
- Dark red circles: the measured quality at each step. There are usually two focus drives in each direction.
What good looks like
The points form a smooth peak at 0, dropping away at roughly the same rate on each side. The drives in the same direction follow the same curve.
If it looks wrong
- Flat sections, or points that rise and fall unevenly near 0: the lens has drive hysteresis. It was told to move but didn't move for several steps. In the first example above, one drive shows a flat run of points from 0 towards the left of the chart.
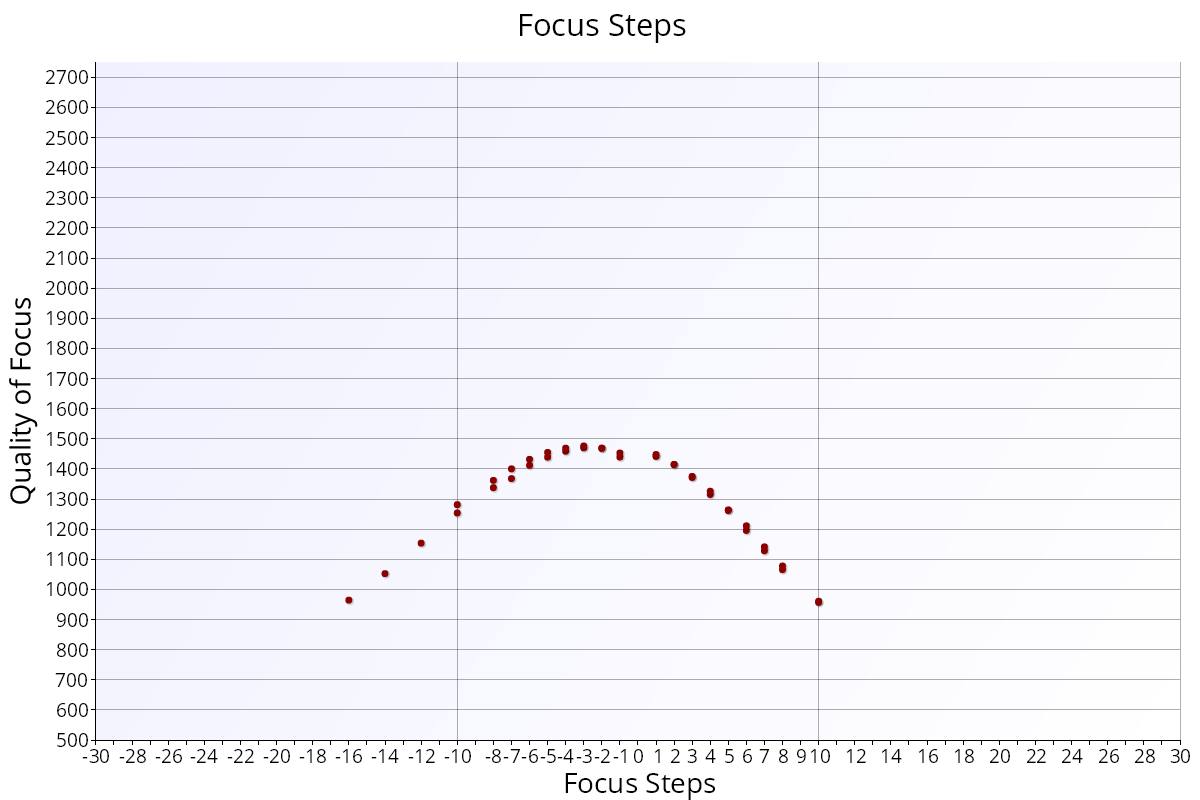
- The peak is not at 0: live view autofocus isn't finding the sharpest point with this lens, so the camera and lens may need their live view focus checked.
This example shows a Canon EF 85mm f/1.2L II on a Canon EOS R. The peak of the curves is clearly not at 0, but nearer -4 or -5:
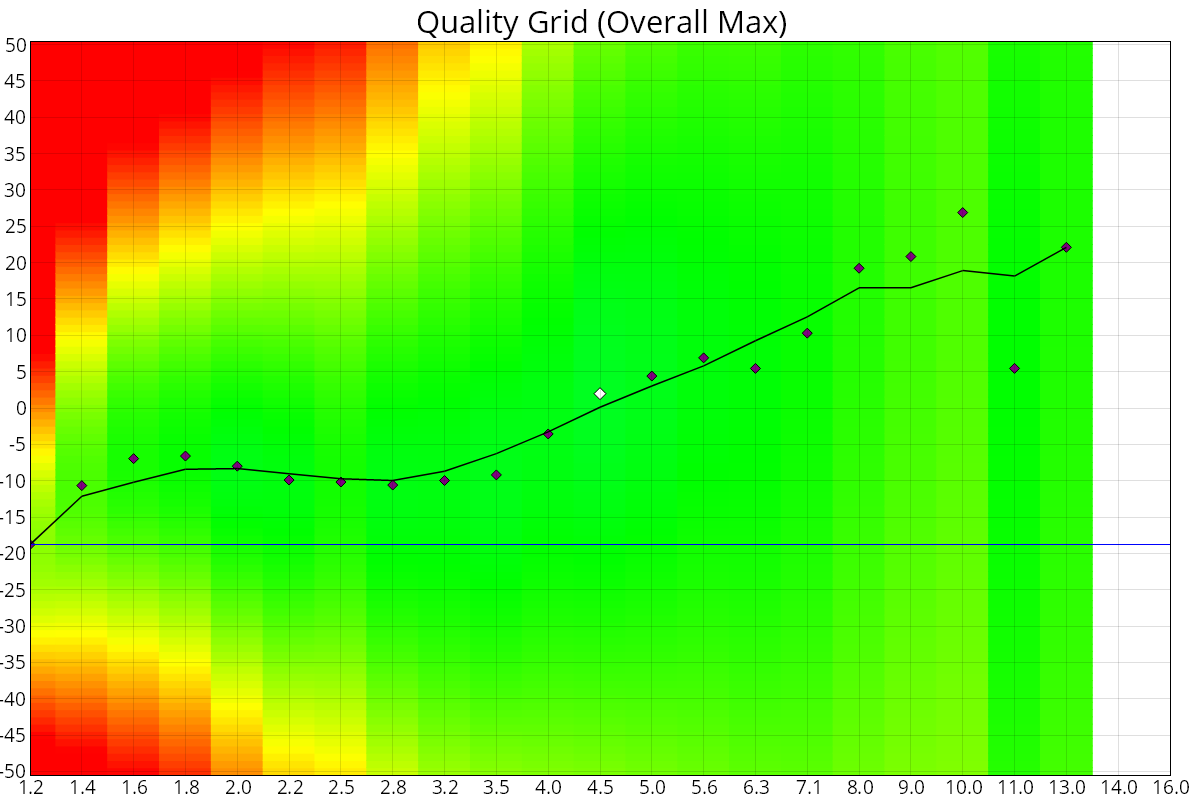
When this happens, the Quality Grid – MultiTest also shows the best focus offset away from 0. Here, the best wide-open focus is at a focus offset of -20: