Result Convergence - Fully Auto Calibration
(See Chart Features for general chart features - changing scales, copying to clipboard etc)
What this shows
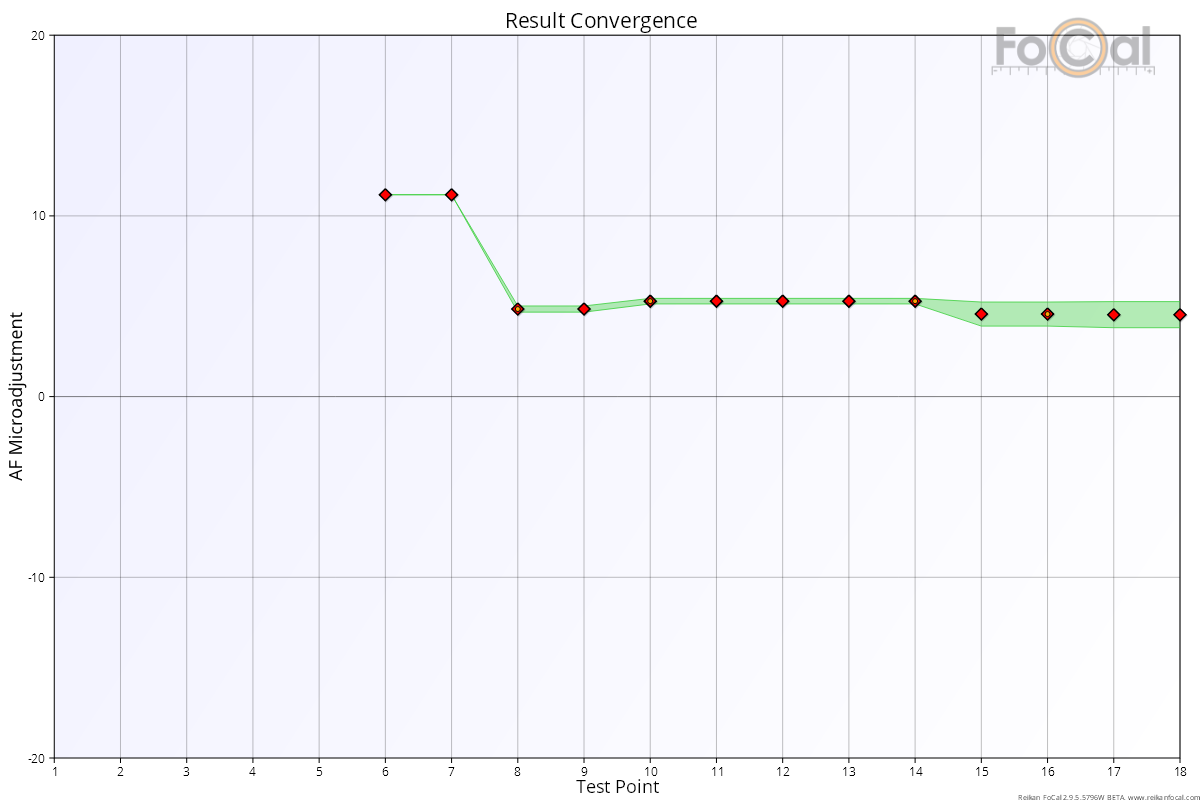
The Result Convergence chart shows how the calibration result developed as each new measurement was added during the test. A good test settles on a stable result well before the end.
How to read it
- Horizontal axis: the test point, in the order the measurements were taken (1 is the first).
- Vertical axis: the calibration result FoCal would have given at that point in the test, in Focus Adjustment units (-20 to +20).
Key:
- Markers: the result after each test point. Green markers were analysed with Target Optimisation on, red markers with it off.
- Green area: the uncertainty in the result at that point. The narrower the area, the more confident the result.
There is no result for the first few points, until FoCal has enough measurements to work one out.
What good looks like
- The result settles to a steady value, with little change over the last few points (the right side of the chart).
- The green area narrows to a thin band as the test goes on.
If it looks wrong
- The result is still moving at the end of the test: the measurements don't agree well. Check the setup and lighting and run the test again. You can also choose more test points or a stricter consistency level (see Settings – Calibration).
- A wide green area covering many Focus Adjustment values: the data is poor and the result is not reliable. Look at the Focus Consistency - Fully Auto Calibration chart, fix the setup and run the test again.