Quality Value – Calibration Check
(See Chart Features for general chart features - changing scales, copying to clipboard etc)
What this shows
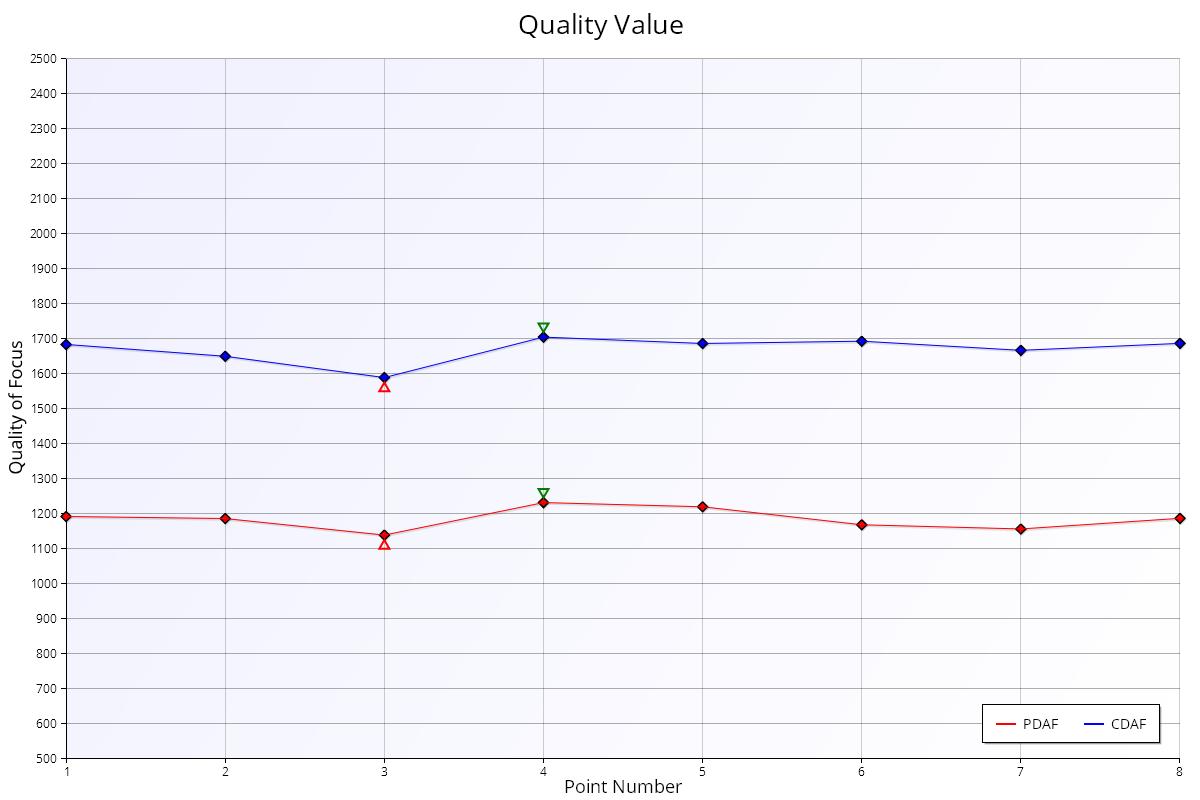
The Quality Value chart shows the actual sharpness (Quality of Focus) of each autofocus shot and each reference shot in the test.
How to read it
- Horizontal axis: measurement (point) number.
- Vertical axis: Quality of Focus, FoCal's sharpness measurement. Higher is sharper.
Key:
- Red diamonds and line (Measured): the camera's normal autofocus shots.
- Blue diamonds and line (Peak): the reference shots.
- Red dashed line: the average measured quality.
- Blue dashed line: the average reference quality.
When the reference is a Live View autofocus shot and FoCal Comparison Data is available for your camera and lens, coloured bands show how sharp this lens typically is on this camera:
- Blue band: typical. The middle half of other users' results (between the first and third quartiles).
- Green area: better than typical.
- Red area: worse than typical.
What good looks like
- The red line at a similar level to the blue line, or higher. The Autofocus System Performance chart shows this difference as a percentage.
- Both lines fairly flat. Big jumps between measurements mean the focus or the setup isn't consistent.
If it looks wrong
- Red well below blue: the autofocus isn't reaching the best focus the lens can achieve. Calibrating is likely to help.
- Both lines low or jumpy: check the lighting, the tripod and the target setup, then run the test again.