Red-Blue Quality – Aperture Sharpness
(See Chart Features for general chart features - changing scales, copying to clipboard etc)
What this shows
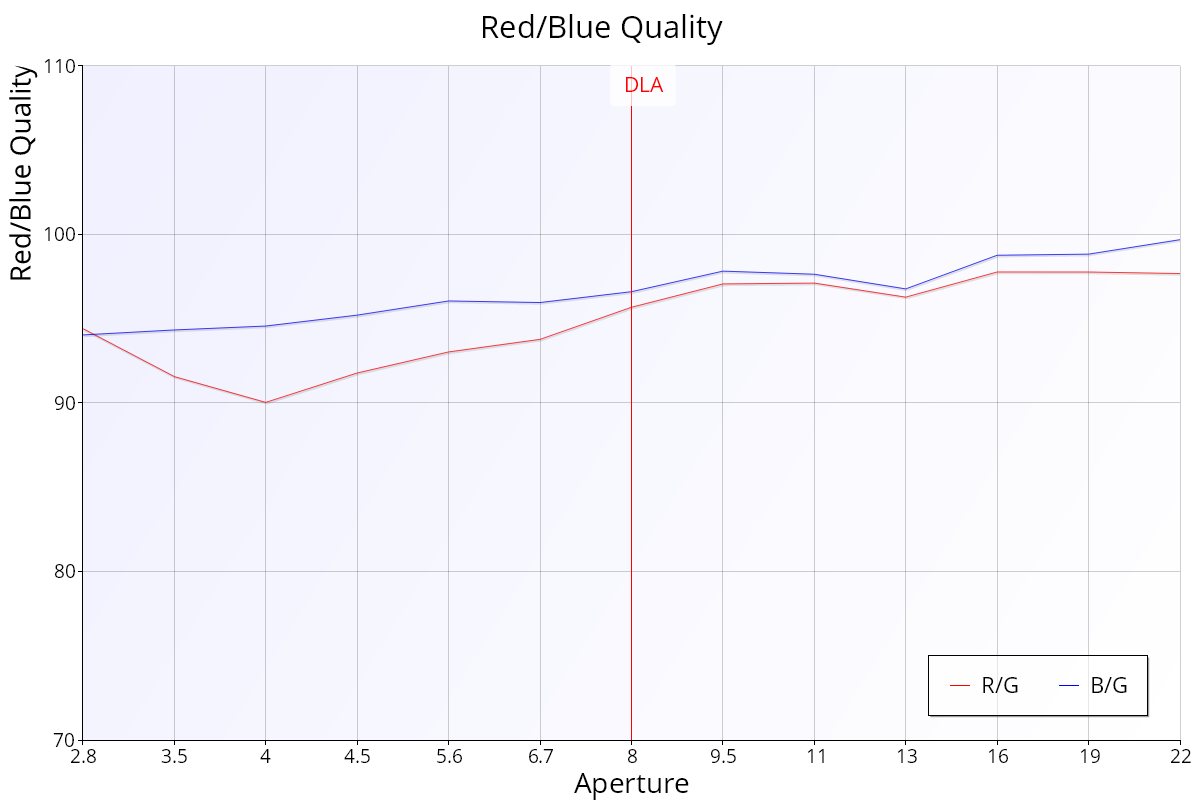
The Red-Blue Quality chart shows the sharpness of the red and blue channels compared with the green channel at each aperture.
How to read it
- Horizontal axis: aperture, wide open on the left.
- Vertical axis: quality as a percentage of the green channel, from 70% to 110%. 100% means the same as green. Above 100%, the channel is sharper than green. Below 100%, it is less sharp.
Key:
- Red line (R/G): red quality compared with green.
- Blue line (B/G): blue quality compared with green.
- Red vertical line labelled DLA: the diffraction limited aperture for your camera.
Most autofocus systems aim for the best focus in green, because our eyes are most sensitive to green. Comparing red and blue with green removes the general shot-to-shot variation, so you can compare red and blue directly. The chart doesn't show absolute sharpness.
What good looks like
- Both lines close to 100%. Values a little below 100% are normal.
- As a guide, FoCal scores the median Red:Green above about 98% as good (above about 96% acceptable), and the median Blue:Green above about 98% as excellent, above about 95% as good and above about 92% as acceptable. With comparison data, the scores compare you with other users of the same camera and lens instead.
If it looks wrong
- Check that the target is lit with roughly white light. Strongly coloured lighting can skew the result (see Spectral Info on the Details – Aperture Sharpness page).
- One line well below 100% throughout, repeatably, means that colour is noticeably softer: a sign of chromatic aberration.
Further Details
No lens focuses every colour at exactly the same point on the sensor. Lenses with dispersion-correcting elements (aspherical, fluorite and so on) get closer, so their red and blue lines sit nearer to 100%.