Astigmatism Factor – Aperture Sharpness
(See Chart Features for general chart features - changing scales, copying to clipboard etc)
What this shows
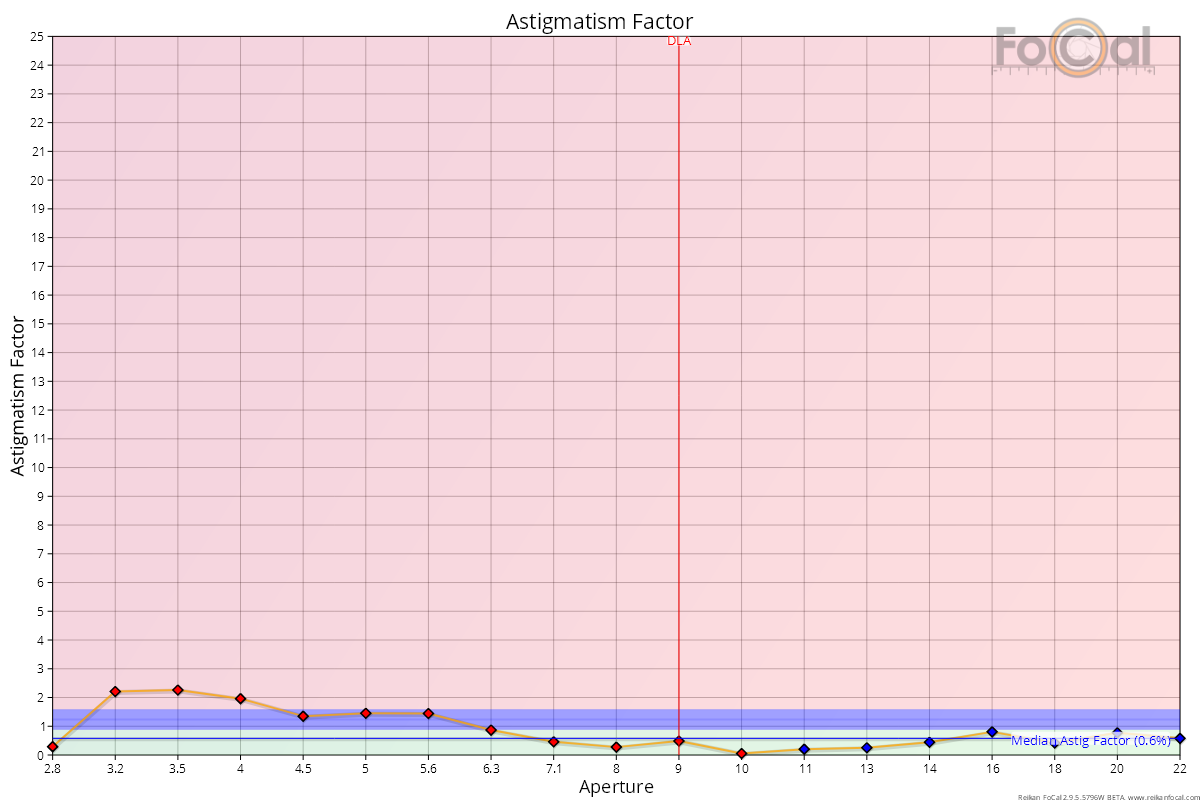
The Astigmatism Factor chart compares the sharpness measured in the horizontal and vertical directions at each aperture. A well-aligned lens is about equally sharp in both directions.
How to read it
- Horizontal axis: aperture, wide open on the left.
- Vertical axis: Astigmatism Factor, from -25% to +25%. 0% means horizontal and vertical sharpness are equal. Above 0%, the horizontal direction is sharper. Below 0%, the vertical direction is sharper. The number is how much sharper, as a percentage.
Key:
- Orange line with markers: the Astigmatism Factor for each shot.
- Blue horizontal line: the median Astigmatism Factor for the test, ignoring direction (the median of the absolute values). It is labelled with its value.
- Red vertical line labelled DLA: the diffraction limited aperture for your camera.
Where FoCal Comparison Data is available for your camera and lens, coloured bands show how your result compares with other users. The bands are symmetrical around 0%, because a difference in either direction counts the same:
- Green band (nearest 0%): better than typical.
- Blue bands: typical. The middle half of other users' results (between the first and third quartiles).
- Red areas (furthest from 0%): worse than typical.
What good looks like
- Points close to 0% across the whole aperture range, and a low median line.
- As a guide, FoCal scores a median below about 1.3% as excellent, below about 2.4% as good and below about 4.8% as acceptable. With comparison data, the score compares you with other users of the same camera and lens instead.
- Some rise as the lens opens up is normal, especially for fast (wide aperture) lenses.
If it looks wrong
- A few points far from 0%, but not a pattern: this is often vibration during those shots. Vibration usually blurs one direction more than the other. Make the setup steadier and run the test again.
- A large value at most apertures, or a big rise at wide apertures, that repeats: the lens may have decentred or misaligned elements. Check the other charts and compare with real-world photos. Consider having the lens checked.
Further Details
Unusual results: a damaged lens
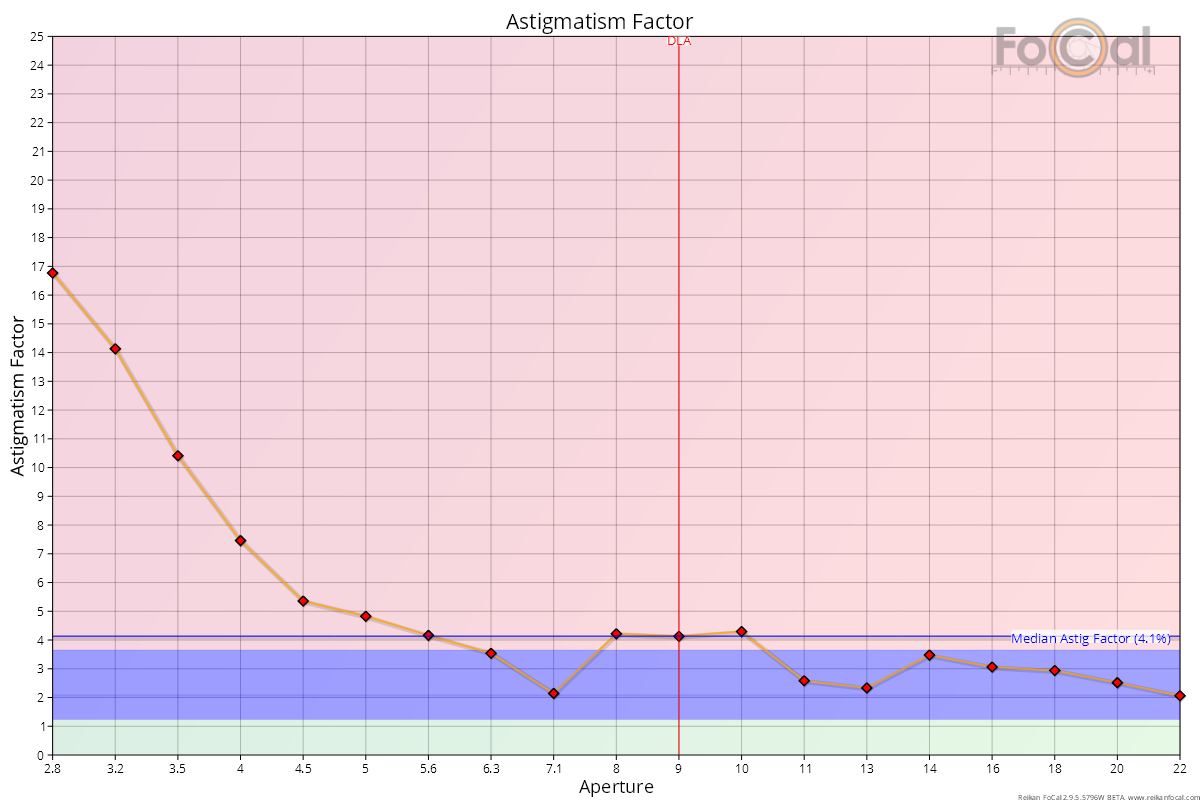
The following chart is from a high-quality lens (Canon EF 24-70mm f/2.8L) that had been damaged by an impact. It was not sharp wide open. Note the large rise in Astigmatism Factor as the aperture opens towards f/2.8:
At f/2.8, a crop of the target looks poor, even for a fast lens like this:

Compare it with the result at f/8: